Cyber&Data: Charting and AnalysisThis provides a foundation in the usage of machine learning in Splunk. Objectives
Content
Step-by-step (Searching)1. Let's open up the broadband.csv data set. This data setup contains a measurement of the percentages of the Internet connections that achieve a given data rate for different countries: [here]. | inputlookup broadband.csv 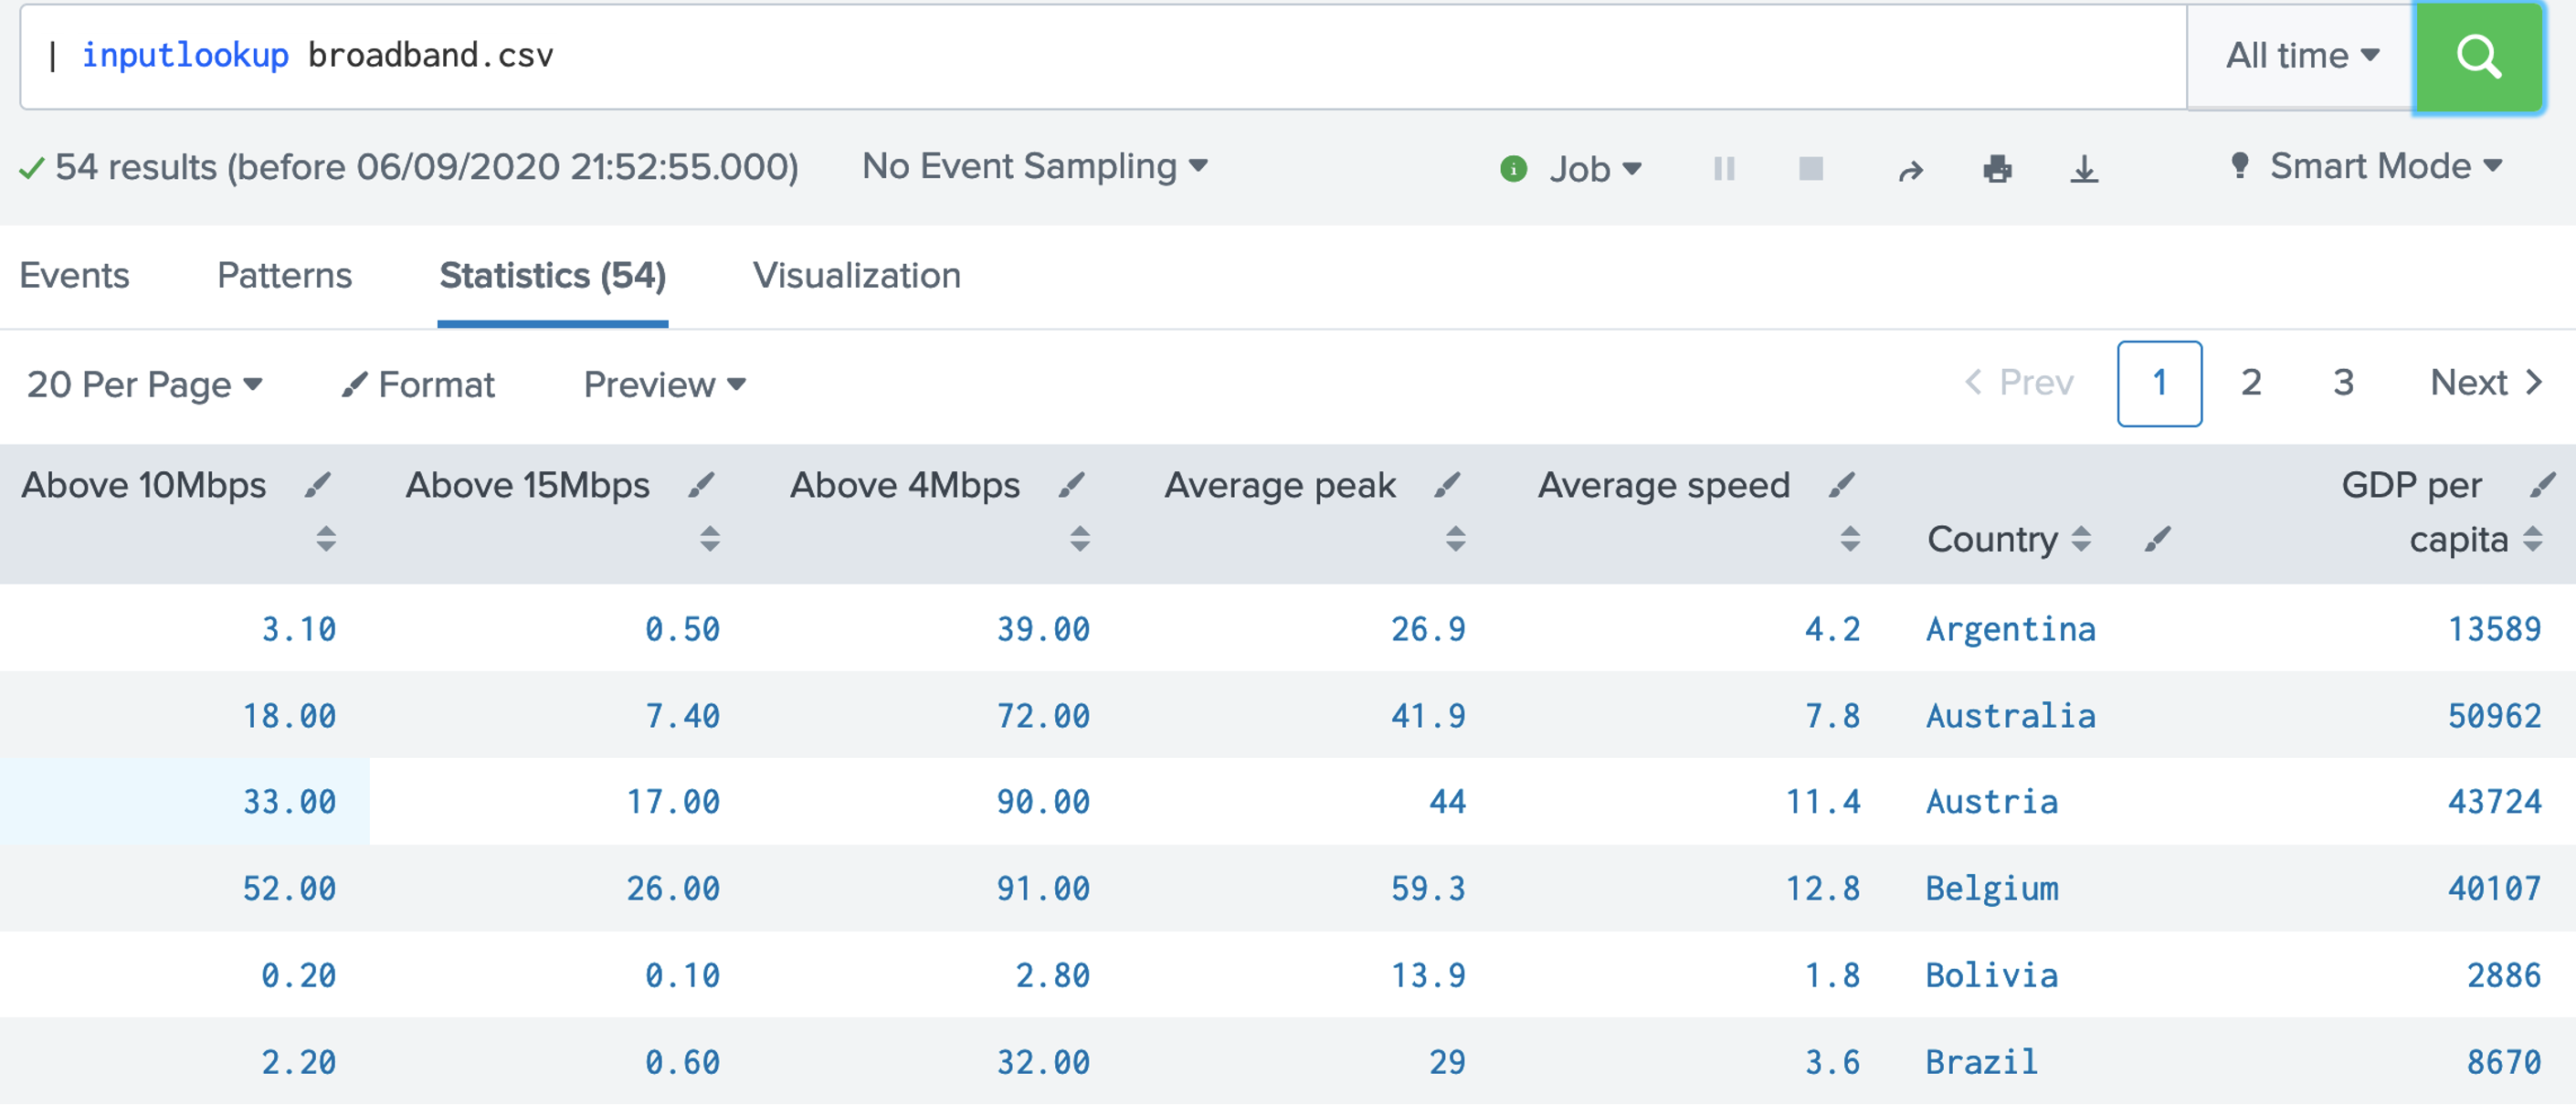 Now answer the following questions: Q. Using the broadband.csv dataset, answer the following: 1. Which country has the largest percentage of 10Mbps broadband? 2. Which country has the lowest percentage of 10Mbps broadband? 3. Which country has the largest average speed for broadband? 4. Which country has the lowest average speed for broadband? 5. Which country has the largest average peak speed for broadband? 6. Which country has the highest GDP per head of the population? 7. Which country has the lowest GDP per head of the population? 8. Which is country name is the first in the alphabet? 9. Which is country name is the last in the alphabet? 10. What is the GDP per capita for Thailand? 11. In what position is the United Kingdom for average speed? 12. For the UK and the USA, who has the highest average speed? 2. Let's open up the internet_traffic.csv data set. This data set contains the total number of bits sent over an Internet connection. First open up the data, and then select the Visualisation tab, and produce the following graph: [here]. | inputlookup internet_traffic.csv 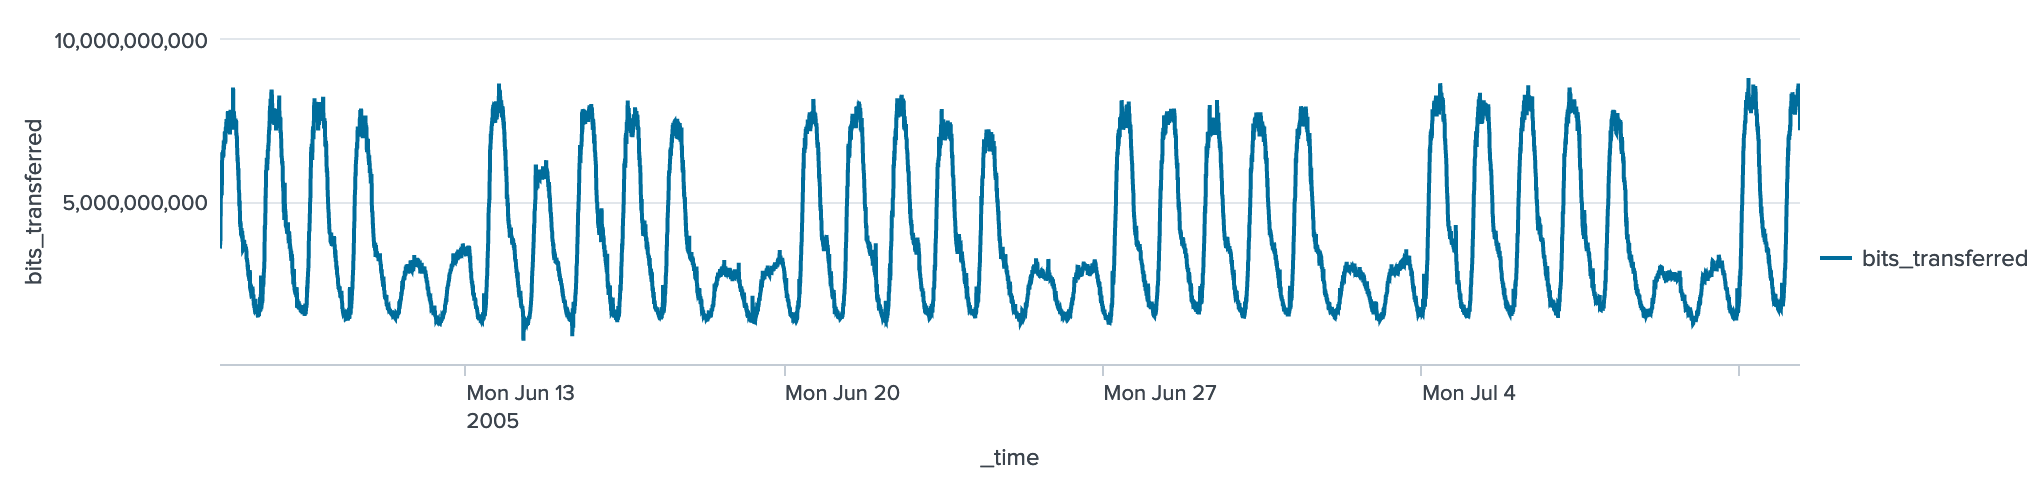 Now answer the following questions: Q. Using the broadband.csv dataset, answer the following: 1. What can be said about the profile of the traffic over time? 3. With the internet_traffic.csv data set, we will now view the statistics tab, and analyse the traffic for the first 10 records: [here]. | inputlookup internet_traffic.csv | head 10 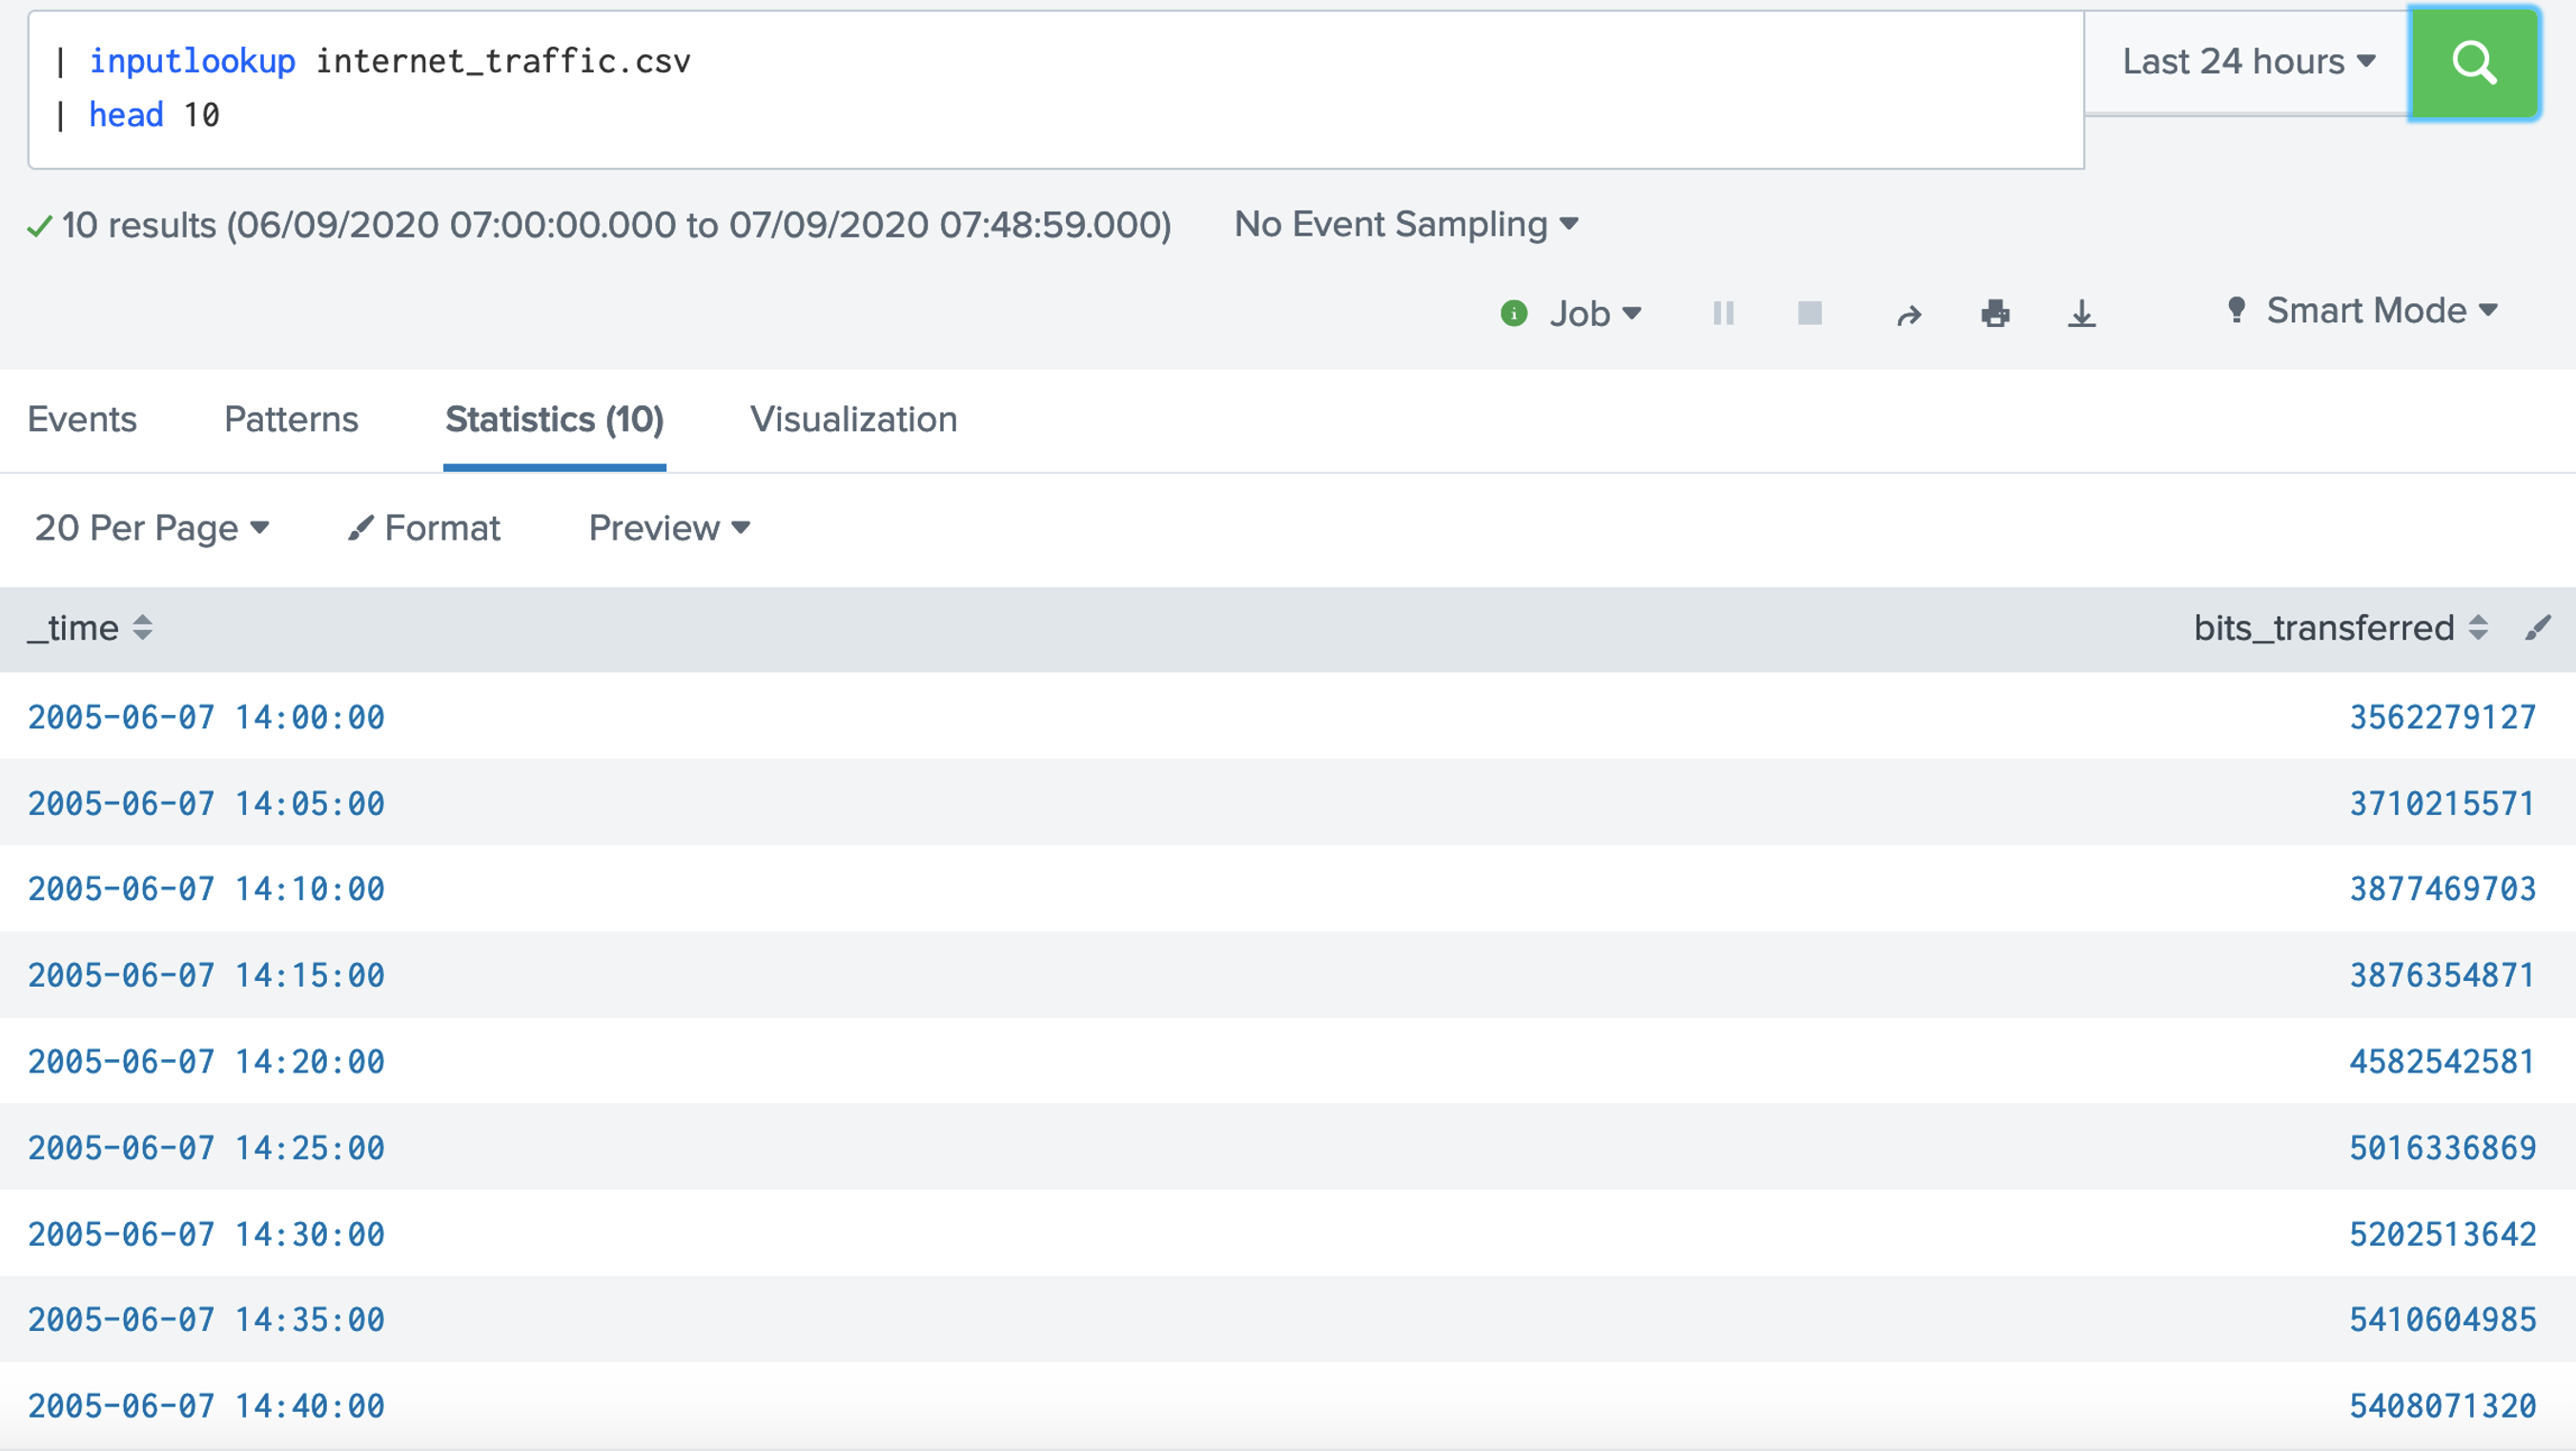 Now answer the following questions: Q. Using the internet_traffic.csv dataset, answer the following: 1. What is the time interval for the samples? 1. What was the time for highest bits transferred? 2. What was the time for lowest bits transferred? 4. Let's now look at the last ten records, and reverse them: [here]. | inputlookup internet_traffic.csv | tail 10 | reverse 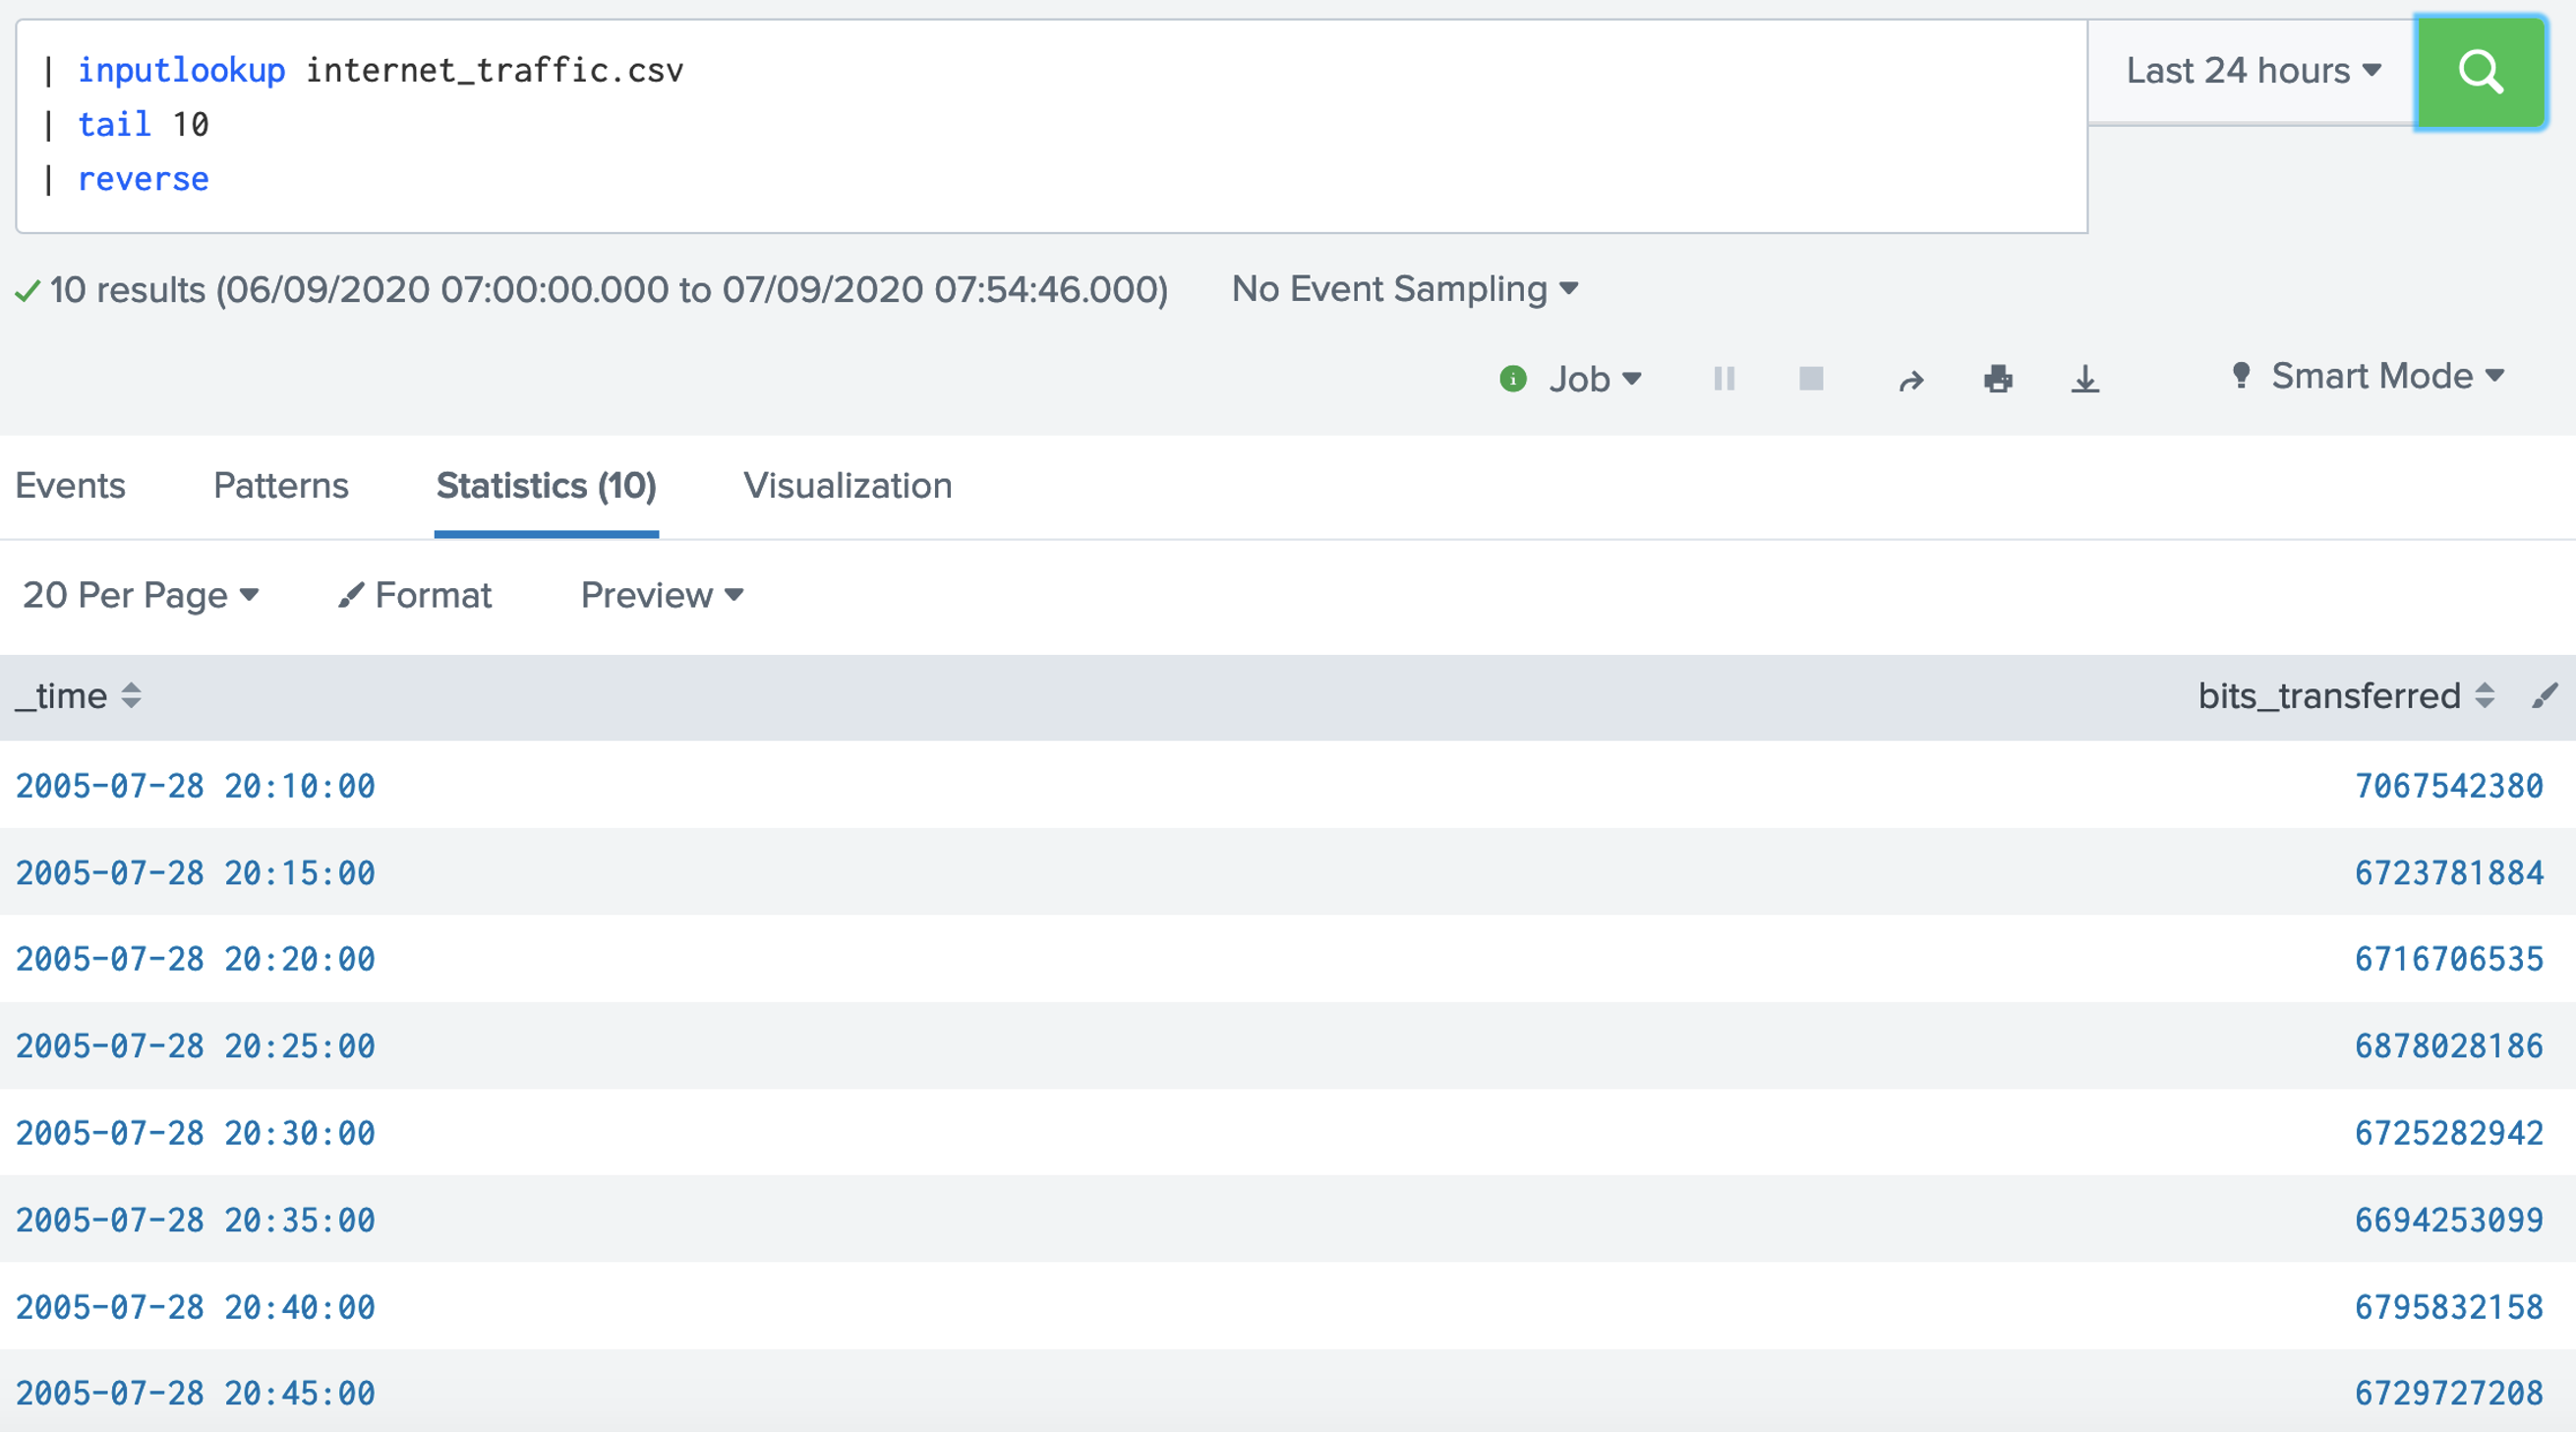 5. Now where can use the "where" modifier to filter our request. In this case we will filter for Internet connections where the average speed is greater than 6Mbps: [here].
| inputlookup broadband.csv where ("Average speed">6)
| reverse
Now answer the following questions: Q. Using the broadband.csv dataset, answer the following: 1. How many countries have an average speed of greater than 6Mbps? 2. Which country has an average speed of 11.4Mbps? 3. How many countries have an average speed of less than 2Mbps? Which countries are they? 4. How many countries have a GDP per capita of less than 5,000? Which countries are they? 5. For countries with a GDP per capita of less than 5,000, which country has the highest Average speed? 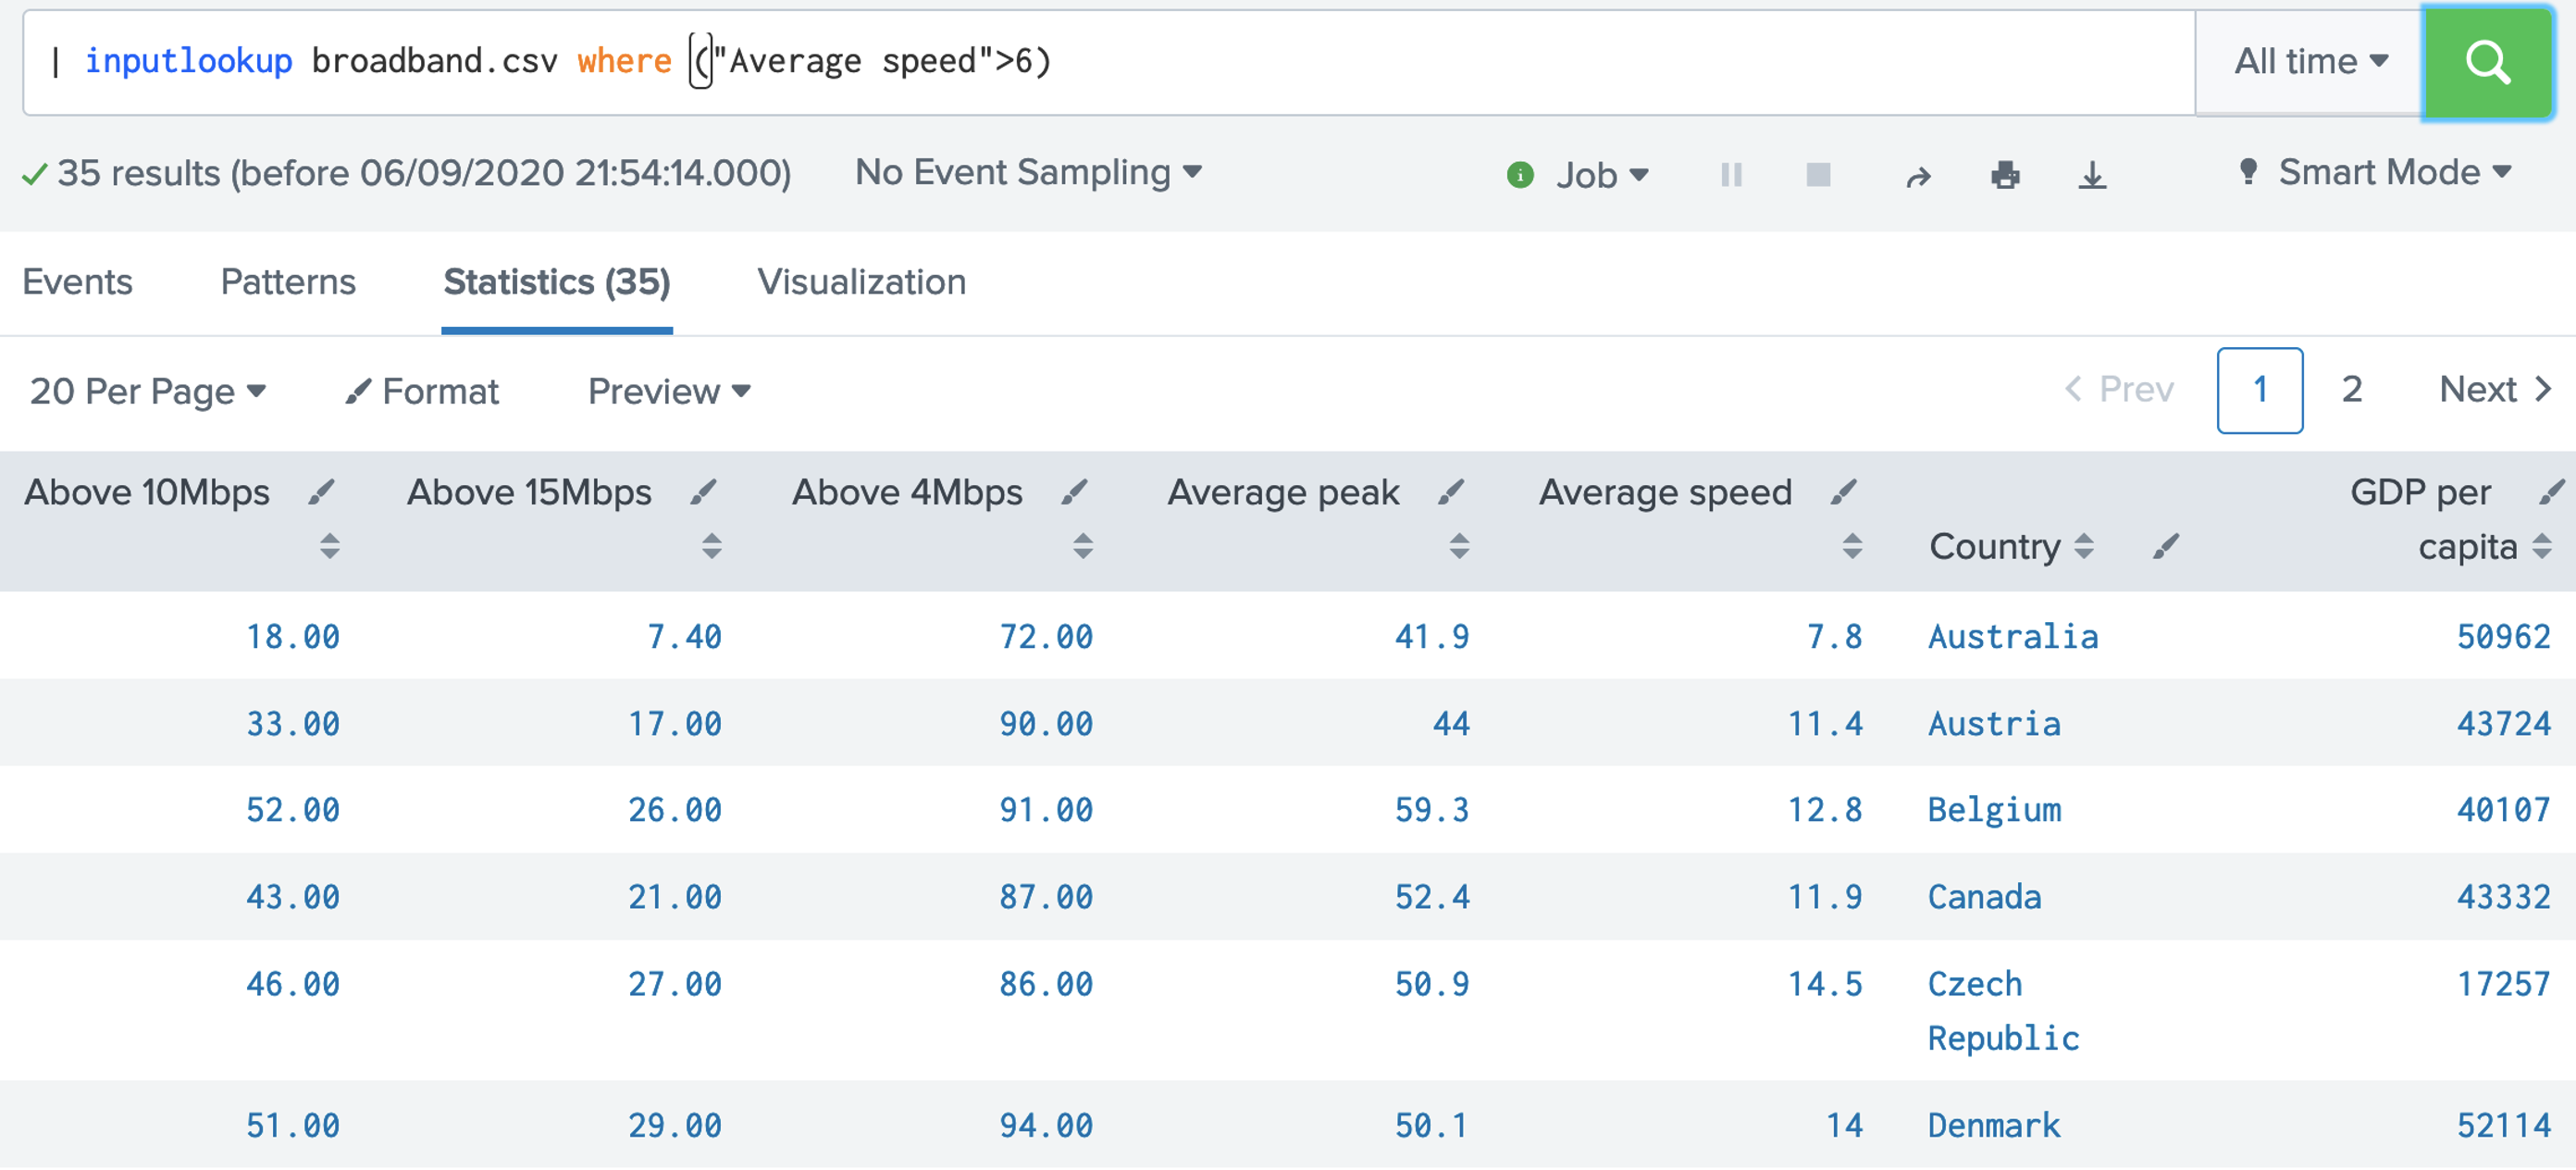 6. We can now use SPL to sort on a given column. In this case we will sort on the average speed:[here].
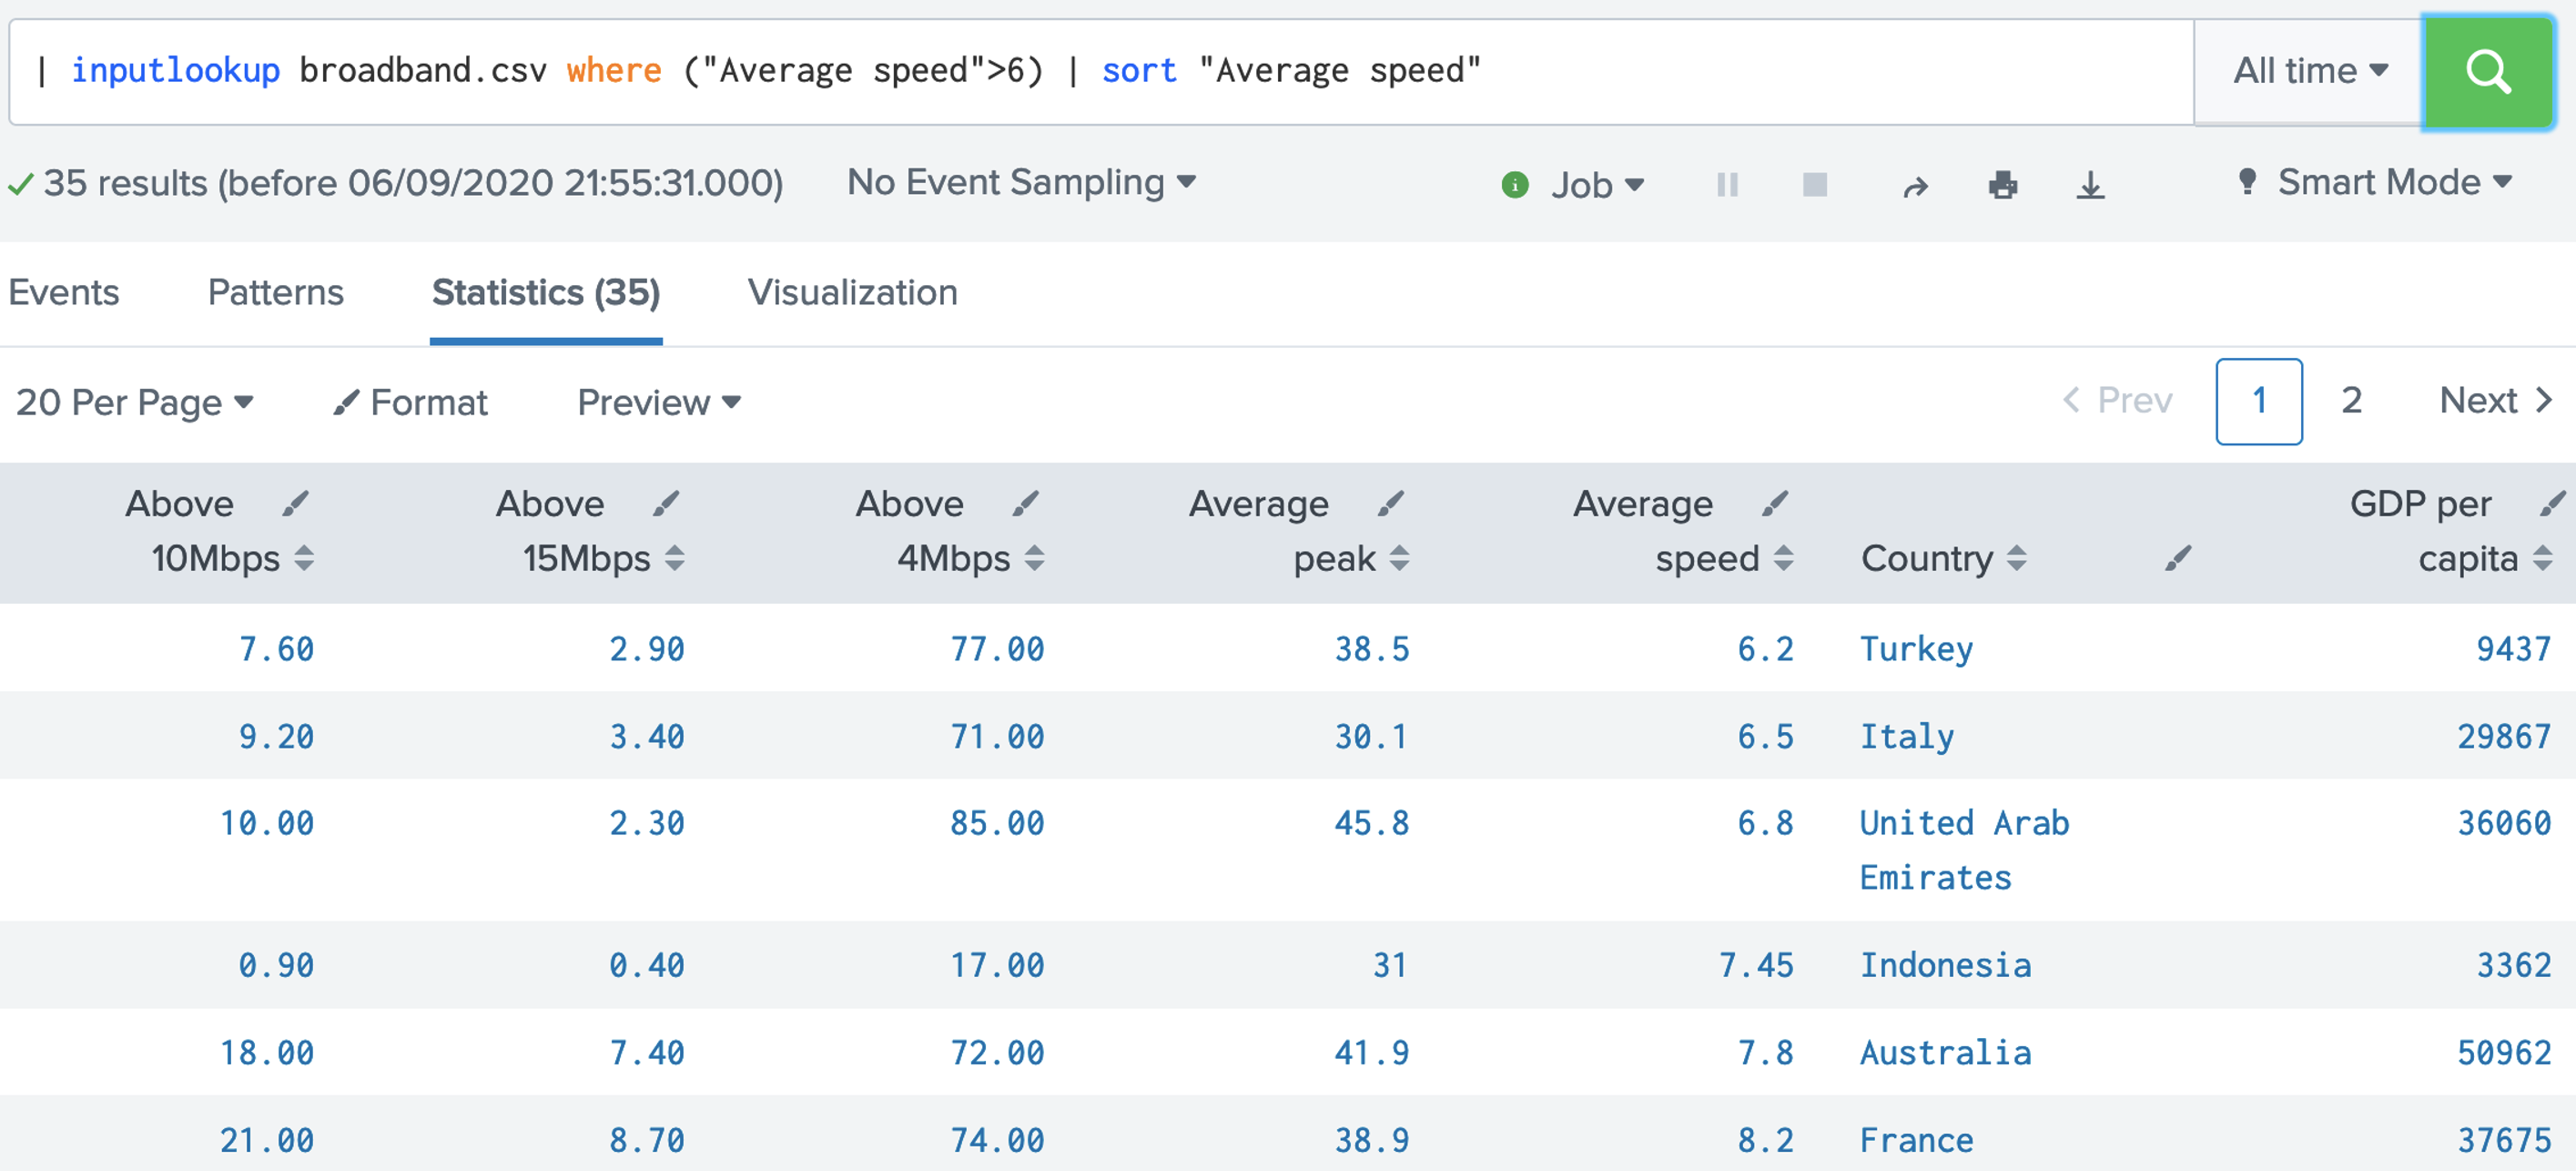
| inputlookup broadband.csv where ("Average speed">6)
| sort "Average speed"
 7. The sort defaults to the lowest value first, so we can modify with the reverse command so that we show the highest first: [here].
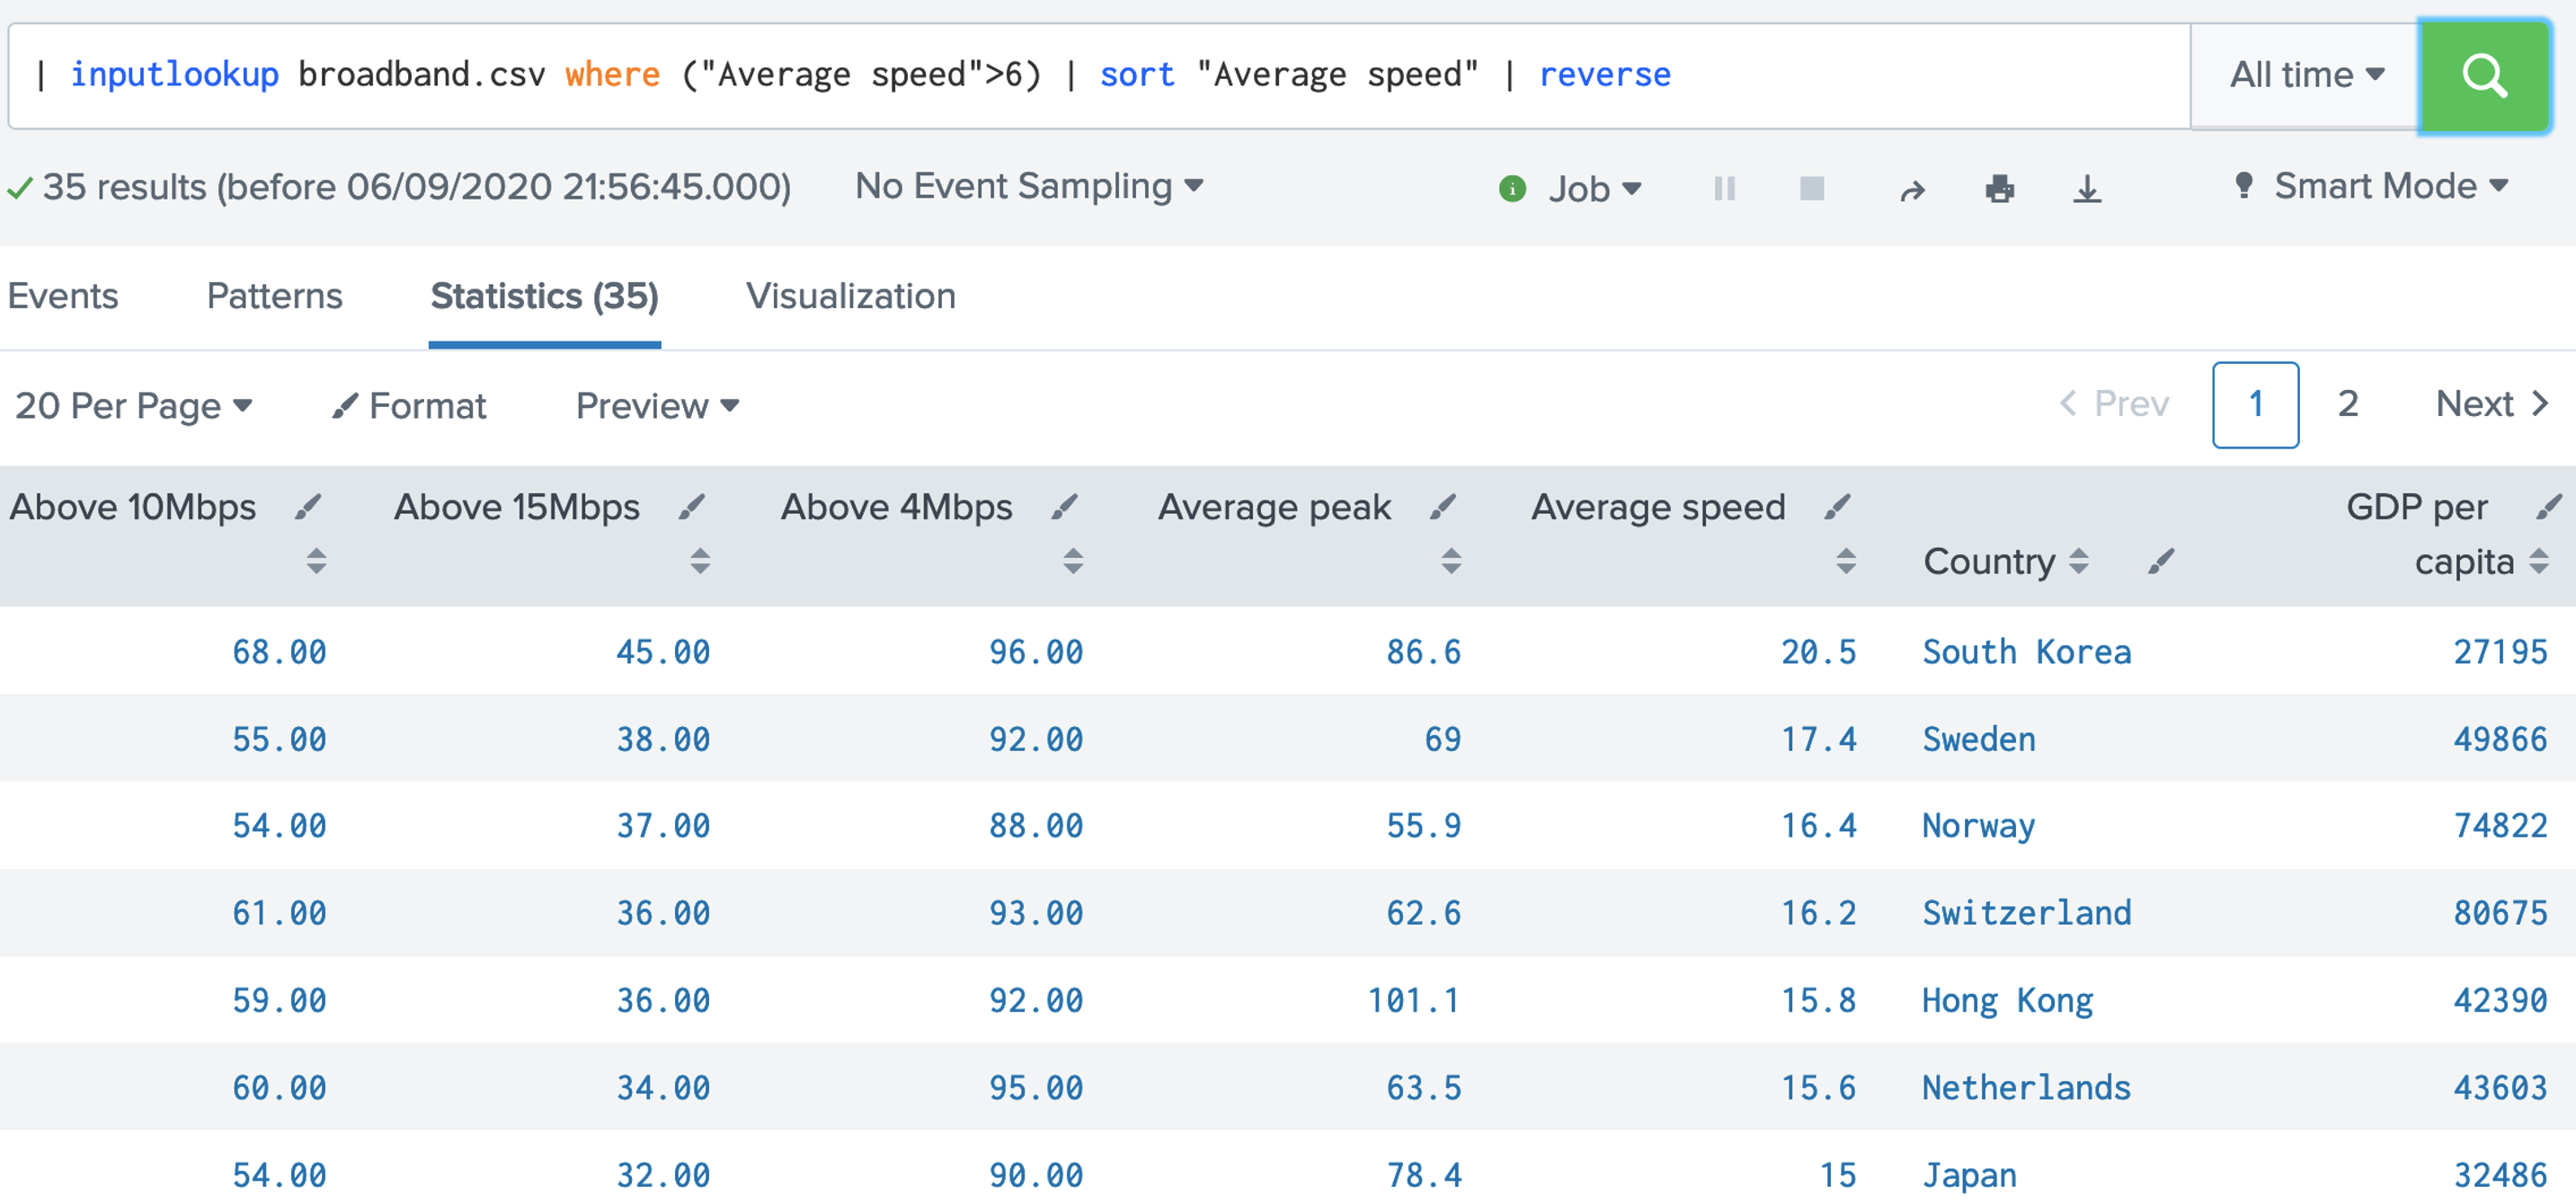
| inputlookup broadband.csv where ("Average speed">6)
| sort "Average speed"
| reverse
 8. With filtering we can use logical operators. If this case we will find the records with an average speed of greater than 6Mbps and where the GDP per capita is less than 10,000: [here].
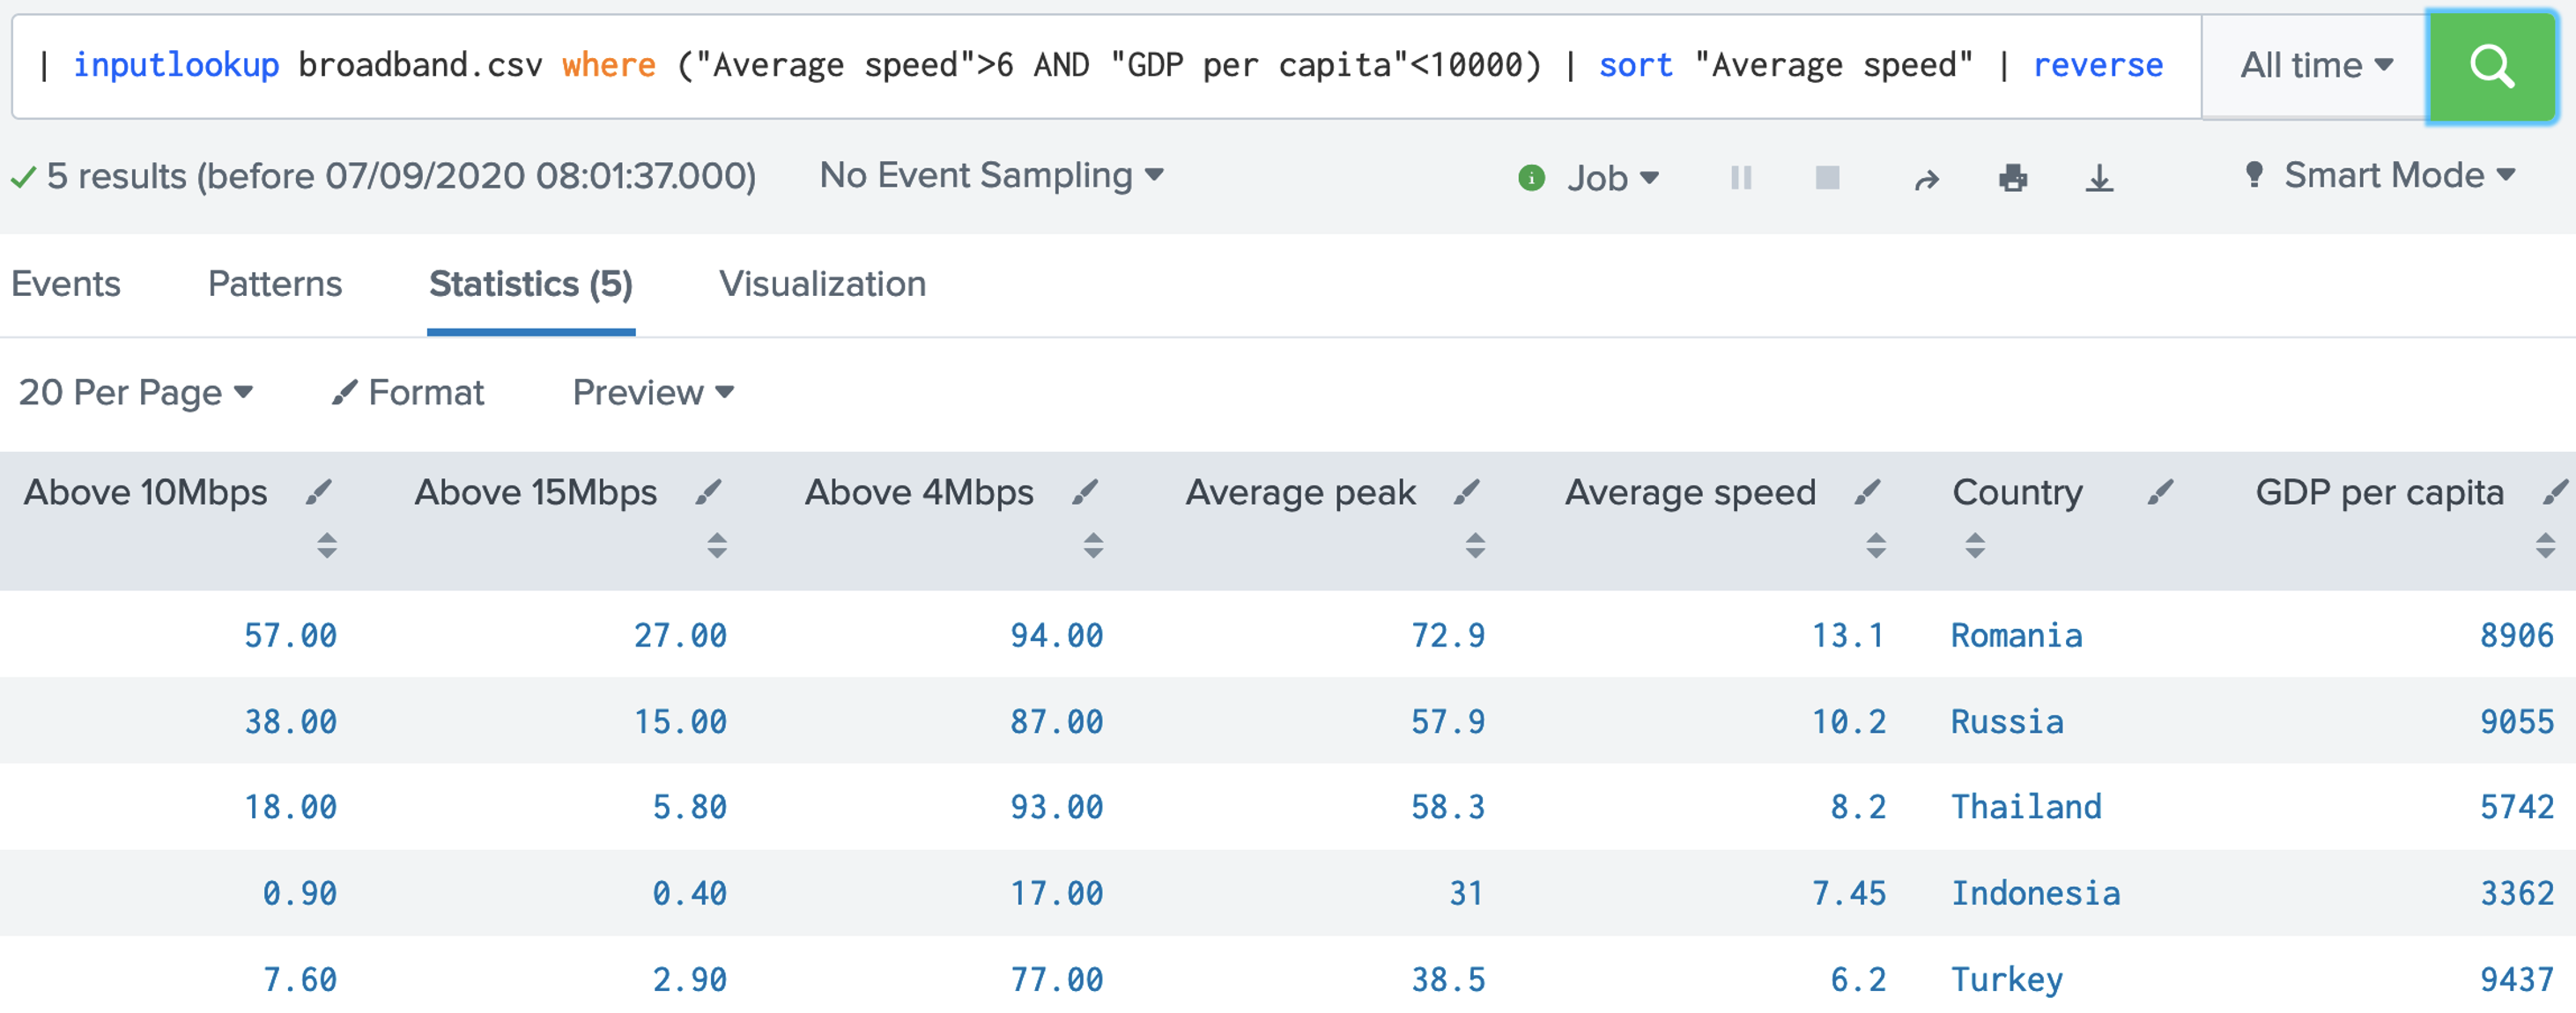
| inputlookup broadband.csv where ("Average speed">6 AND "GDP per capita"<10000)
| sort "Average speed"
| reverse
 Now answer the following questions: Q. Using the broadband.csv dataset, answer the following: 1. How many countries have an average speed of greater than 6Mbps and an average peak of less than 50Mbps? 2. How many countries have an average speed of greater than 6Mbps or an average peak of less than 50Mbps? 3. Which countries have an average speed less than 5Mbps and a GDP per capita of greater than 10,000? 4. Which countries have an average peak of greater than 20Mbps and a GDP per capita of greater than 50,000? 5. Which country has over 30% or more for above 15Mbps speeds and where the average speed is greater than 20Mbps? Step-by-step (Analysis and Charting)1. First, open up the Buttercup games Splunk site: [here]. post status=200 action=purchase | top categoryId 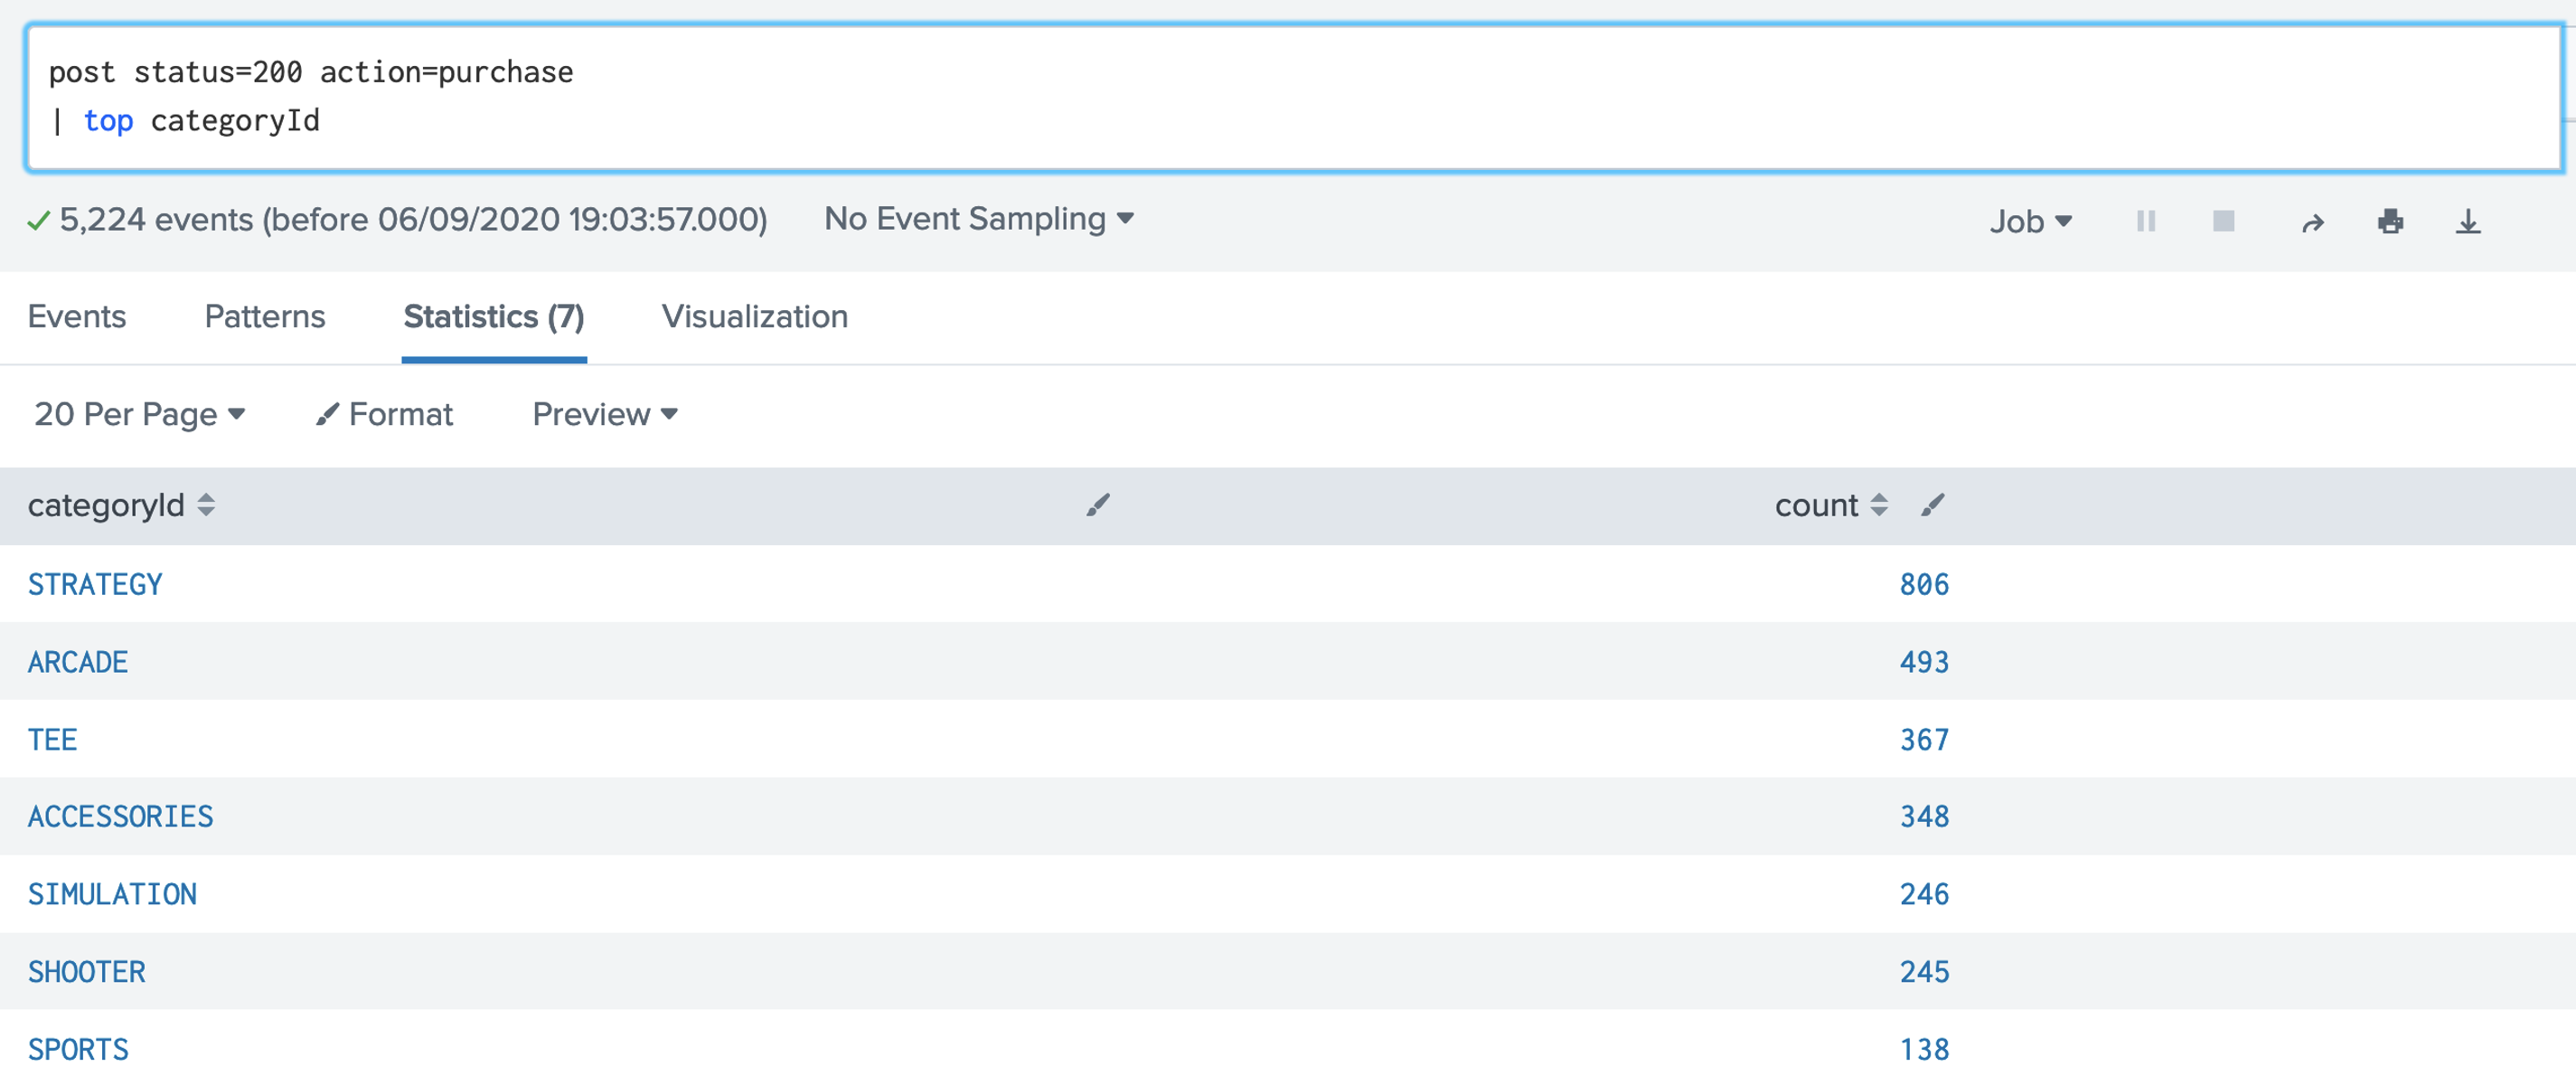 Now answer the following questions: Q. Using the Buttercup games dataset, answer the following: 1. Modify the filter so that it displays the top productID? Which is the top Product ID and how many times was it included in a successful purchase action? 2. Modify the filter so that it displays the top clientip? Which is the top Client IP and how many times was it included in a successful purchase action? 3. Modify the filter so that it displays the top refer? Which is the top refer and how many times was it included in a successful purchase action?
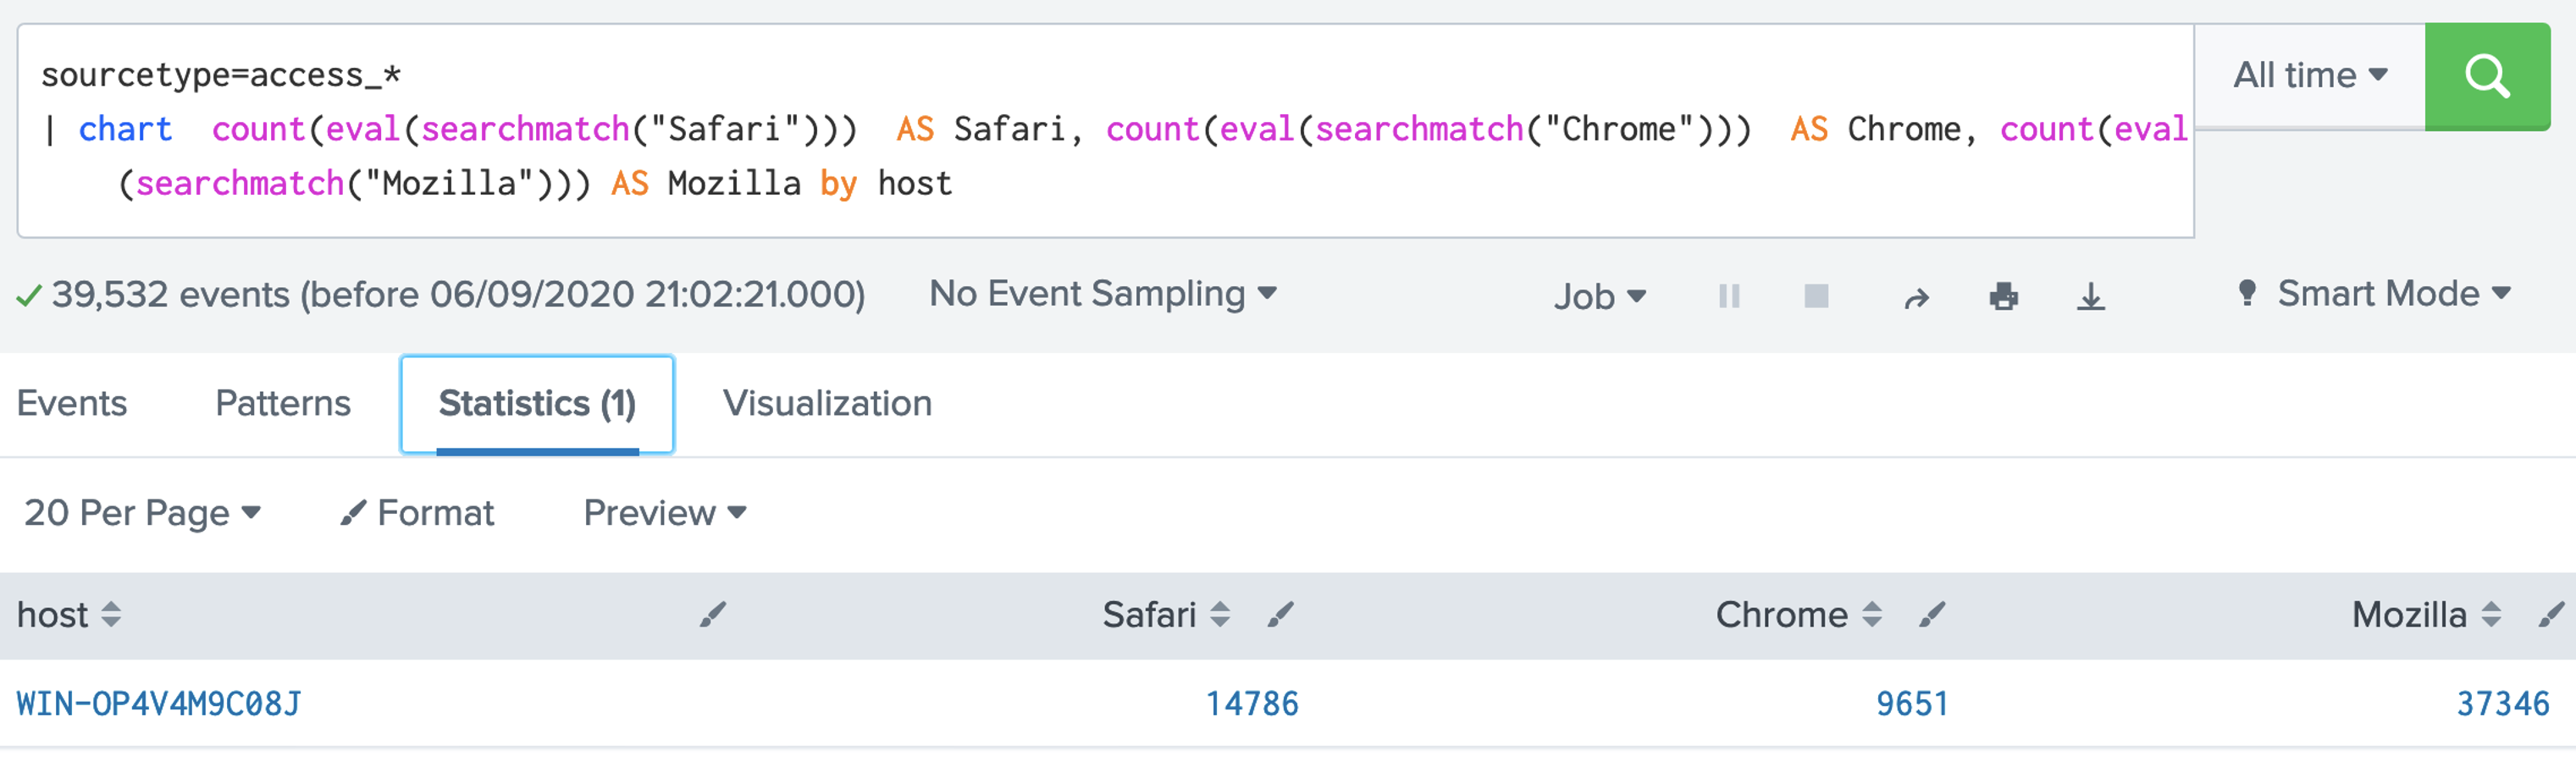
2. SPL has a number of functions we can use. Examples of aggregation functions are: avg(X); count(X); dc(X); max(X);mean(X); median(X); min(X); mode(X); range(X); stdev(X); sum(X); sumsq(X); var(X). Let's use the dc() function, and which is distinct count: [here]sourcetype=access_* | stats dc(status),dc(productId),dc(categoryId) Now answer the following questions: Q. Using the Buttercup games dataset, answer the following: 1. Modify the filter so that it displays the count of the number of distinct status code values. What the number of distinct values? 2. Modify the filter so that it displays the count of the number of status code values. What the count, and why does it differ from the number of distinct values? 3. Modify the filter so that it displays the maxiumum value of the status codes. What the maximum value? 4. Modify the filter so that it displays the minimum value of the status codes. What the minimum value? 5. Modify the filter so that it displays the range of status codes. What the range? 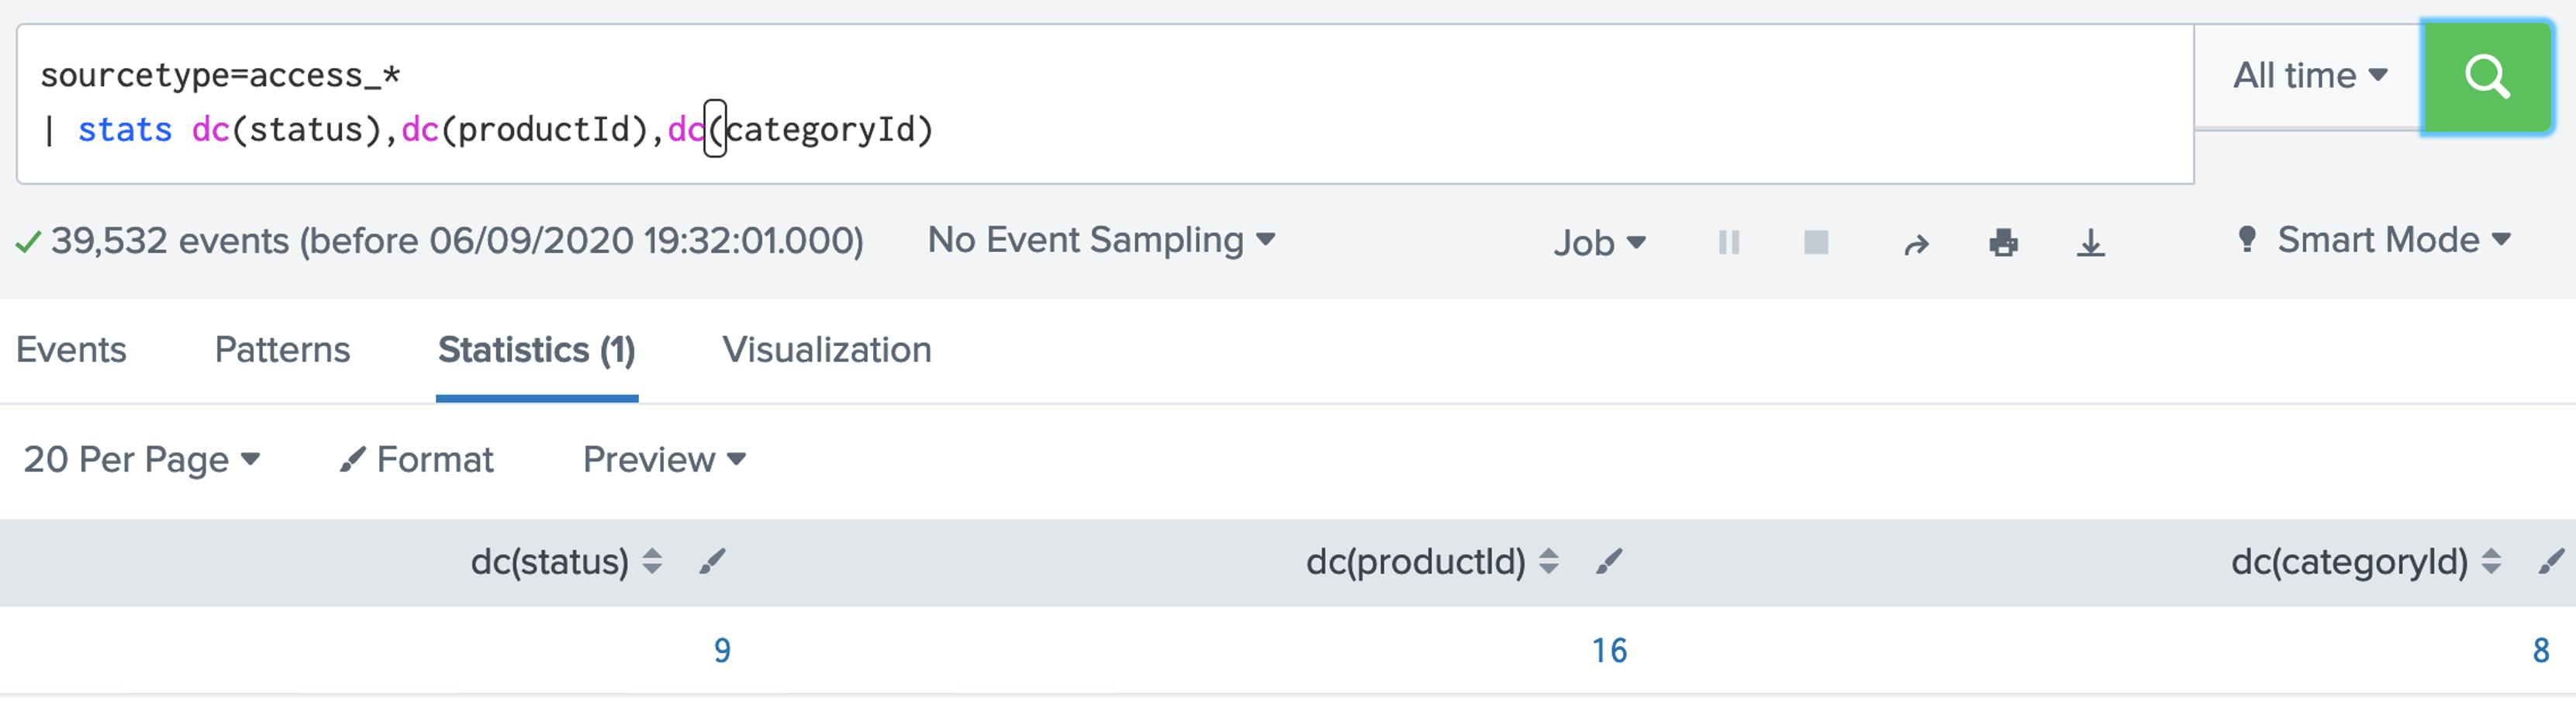 3. Now give the columns of our data a name for this we use the "AS" modifier: [here]: sourcetype=access_* | stats dc(status) as Status,dc(productId) as "Product ID",dc(categoryId) as "Category ID" 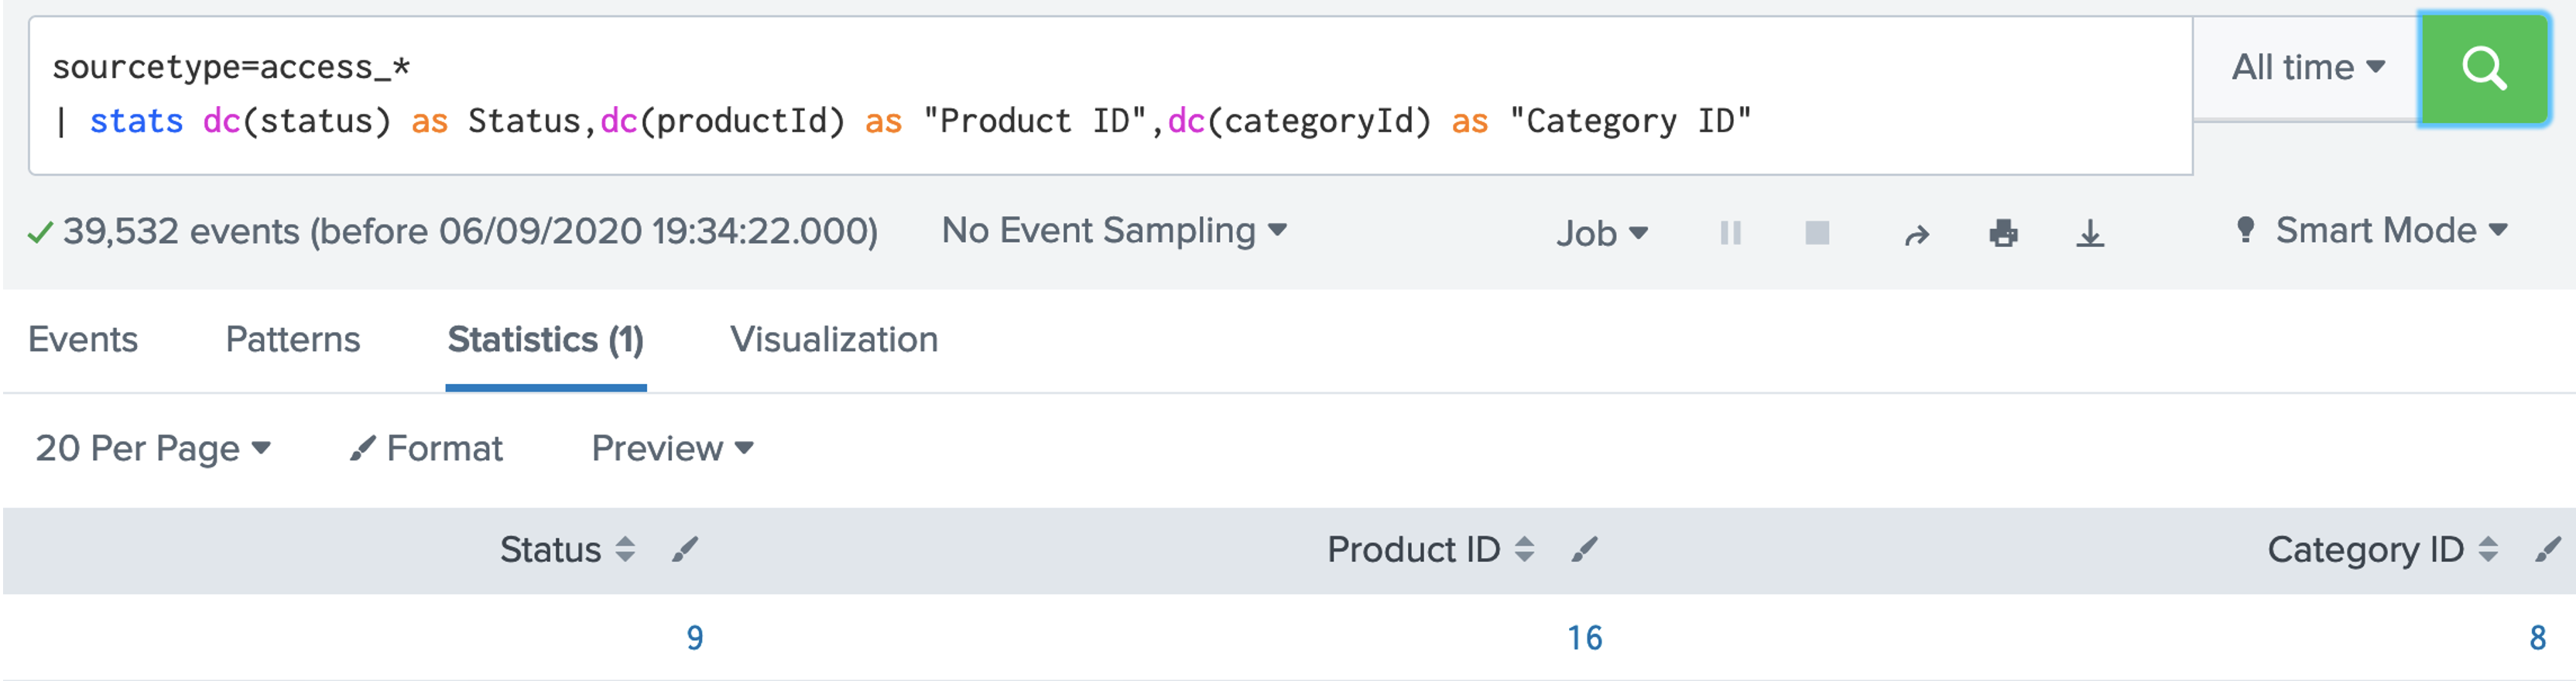 Now answer the following questions: Q. Using the Buttercup games dataset, answer the following: 1. Modify the filter so that it displays columns with the names "Buttercup Status", "Buttercup Product IDs" and "Buttercup Category IDs". 2. Now modify the filter so that is provides a table for the number of distinct client IPs (clientIP), status codes (status), product IDs (productId), category IDs (categoryId) and referers (refer). 4. Now let's list for an action of "purchase" and then dc() for the client IP address: [here] sourcetype=access_* action=purchase | stats dc(clientip) BY categoryId 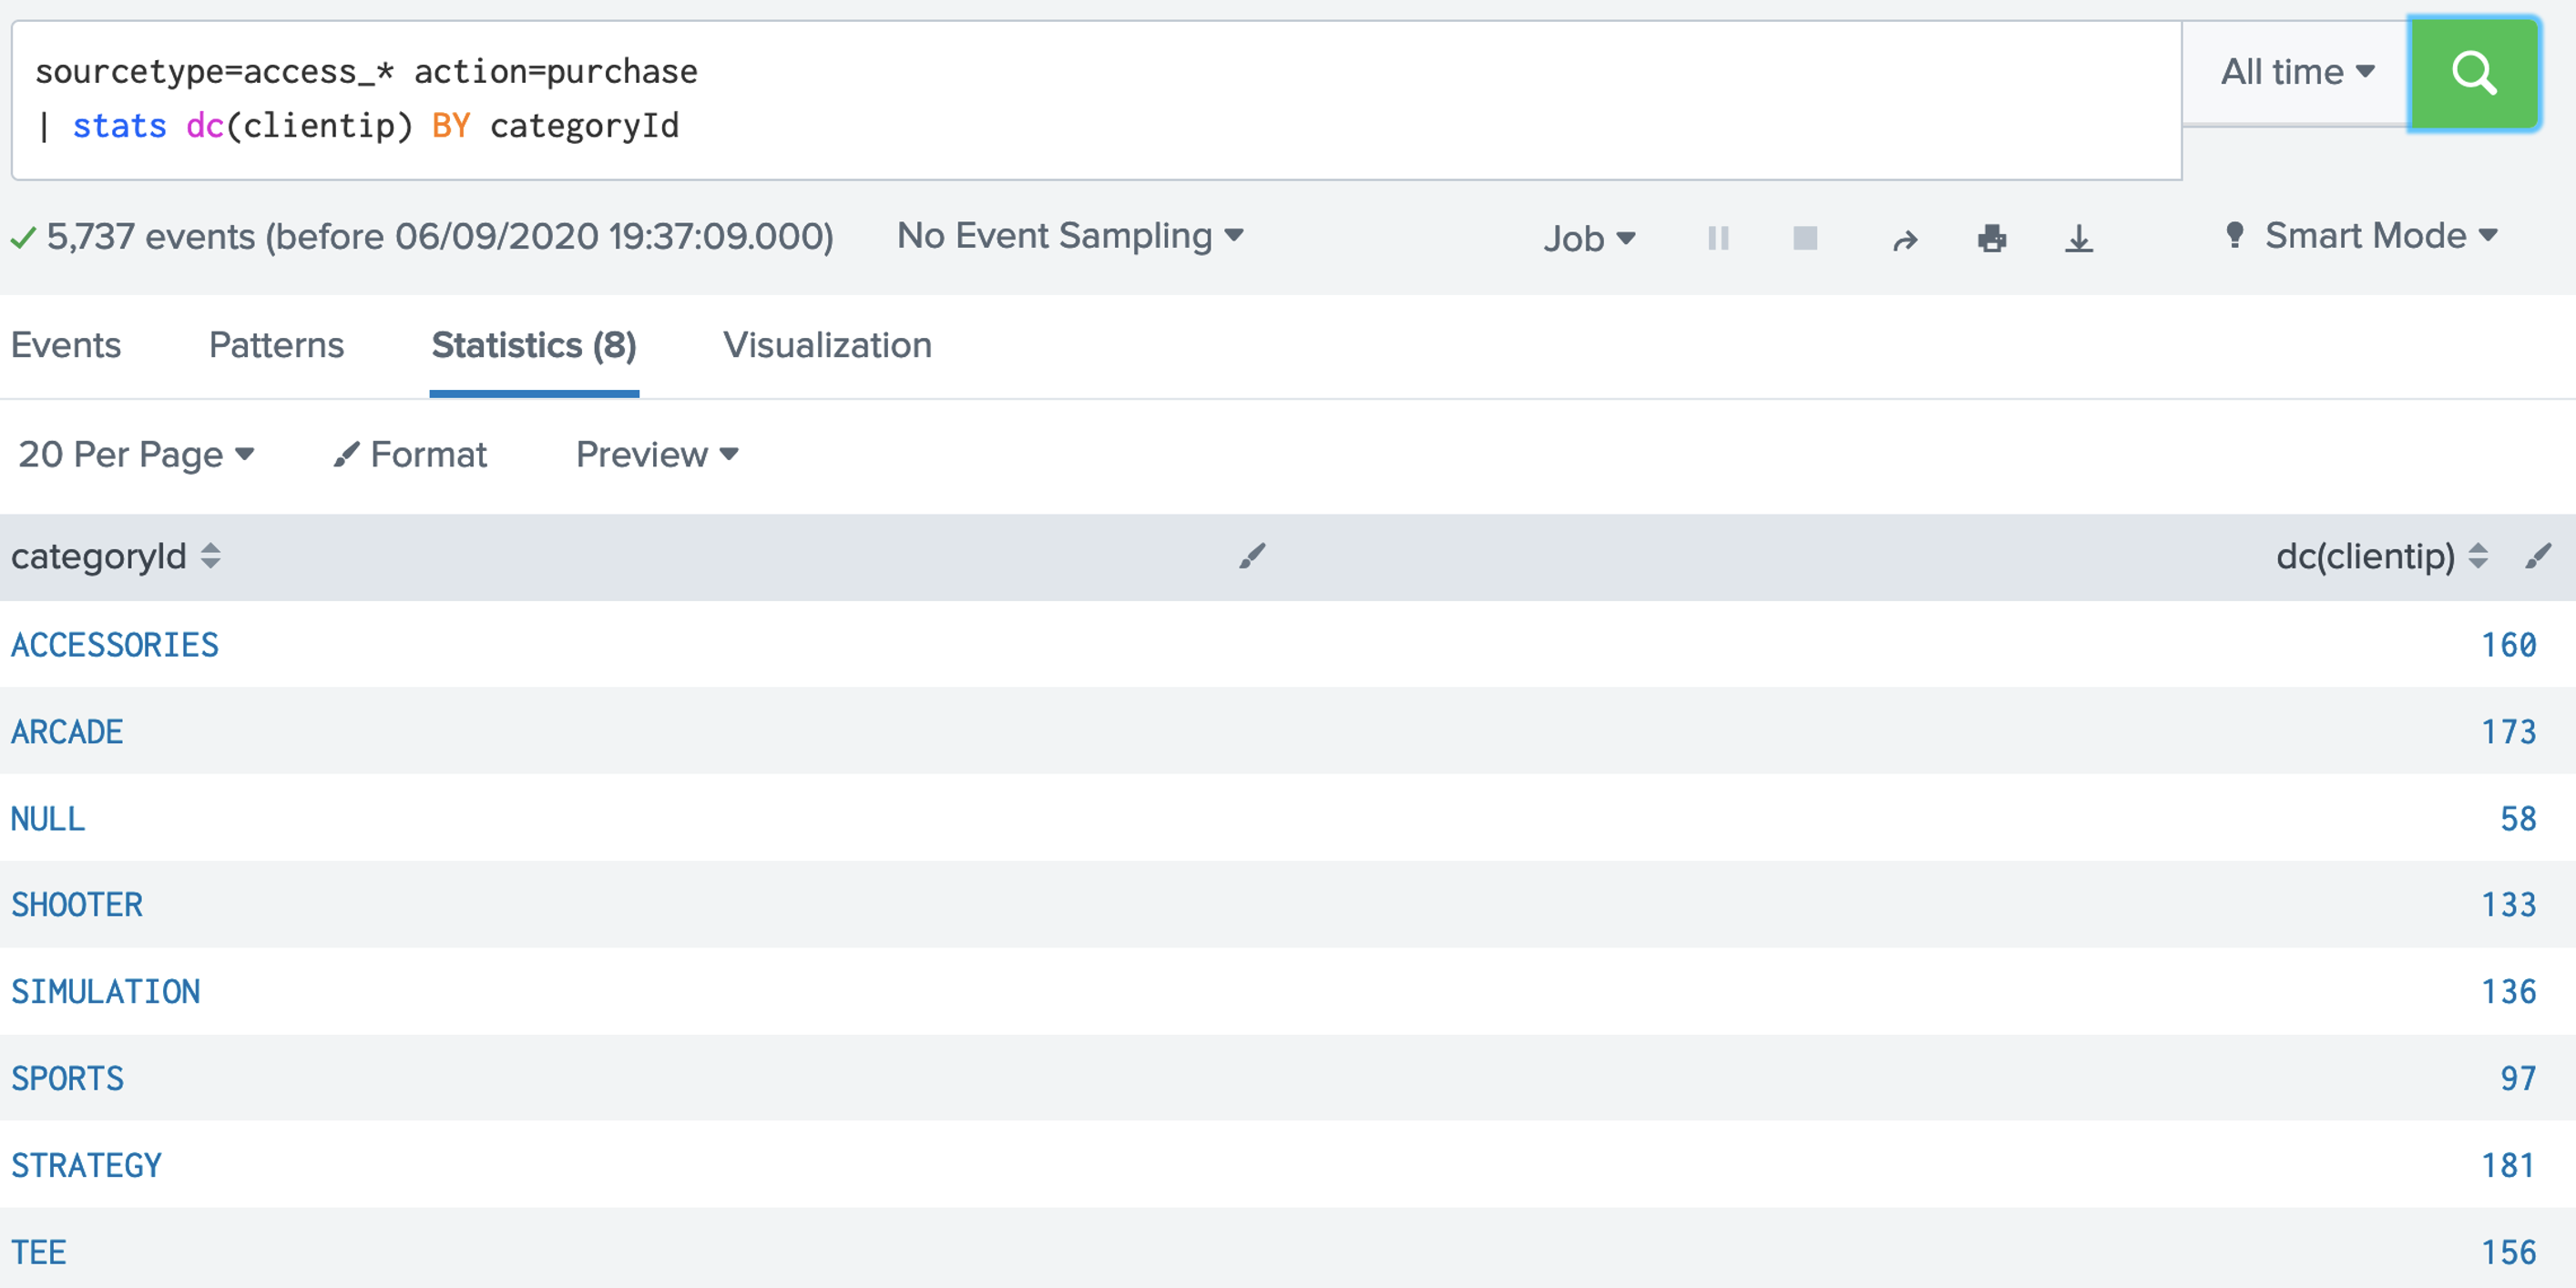 Now answer the following questions: Q. Using the Buttercup games dataset, answer the following: 1. Modify the filter so that it displays the number of distinct IP addresses for productID. Which product ID has the most distinct IP addresses for a product, and which product is it? 2. Which useragent has the highest number of distinct IP addresses? 5. We can now search for a given status code using the eval() function, and then count the return values: [here] sourcetype=access_* | stats count(eval(status="404")) AS count_status BY sourcetype 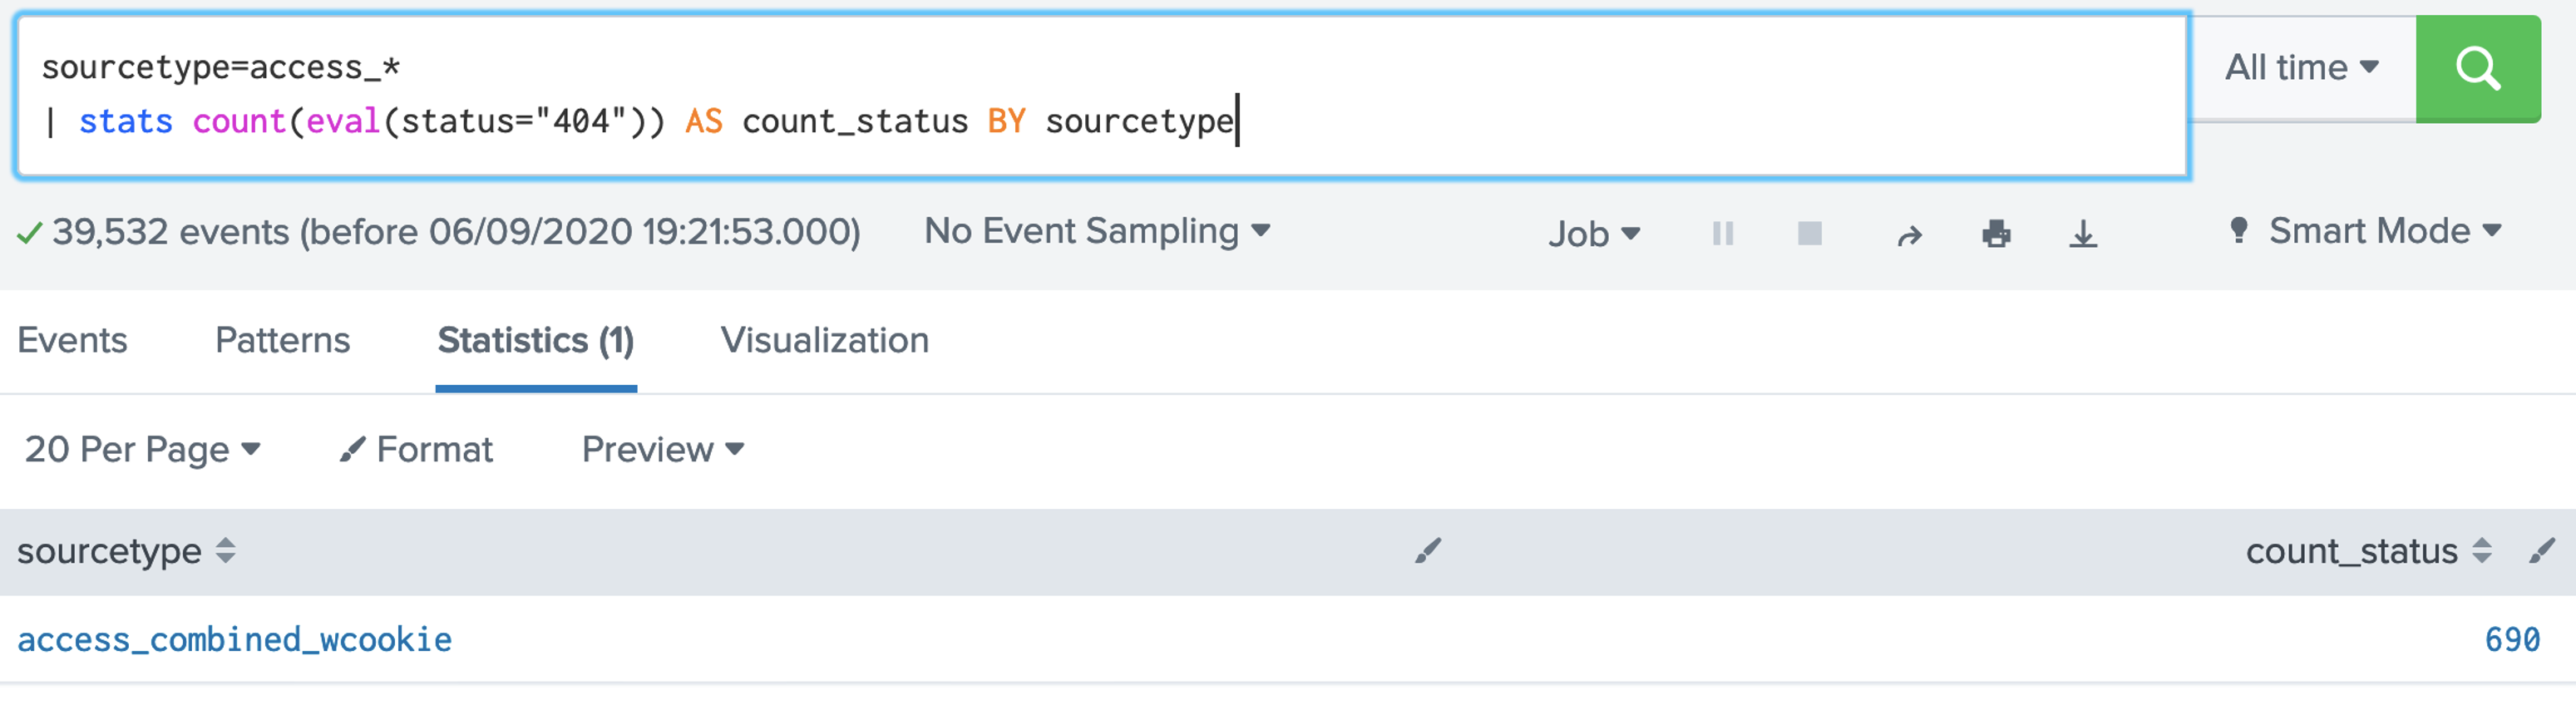 Now answer the following questions: Q. Using the Buttercup games dataset, answer the following: 1. Modify the filter so that it displays a table of the count for the status codes of 200, 400, 403, 404, 408, 500, and 503. What are the count on these? 6. We can now modify to use a timechart method: [here] sourcetype=access_* | timechart count(eval(action="purchase")) BY productName 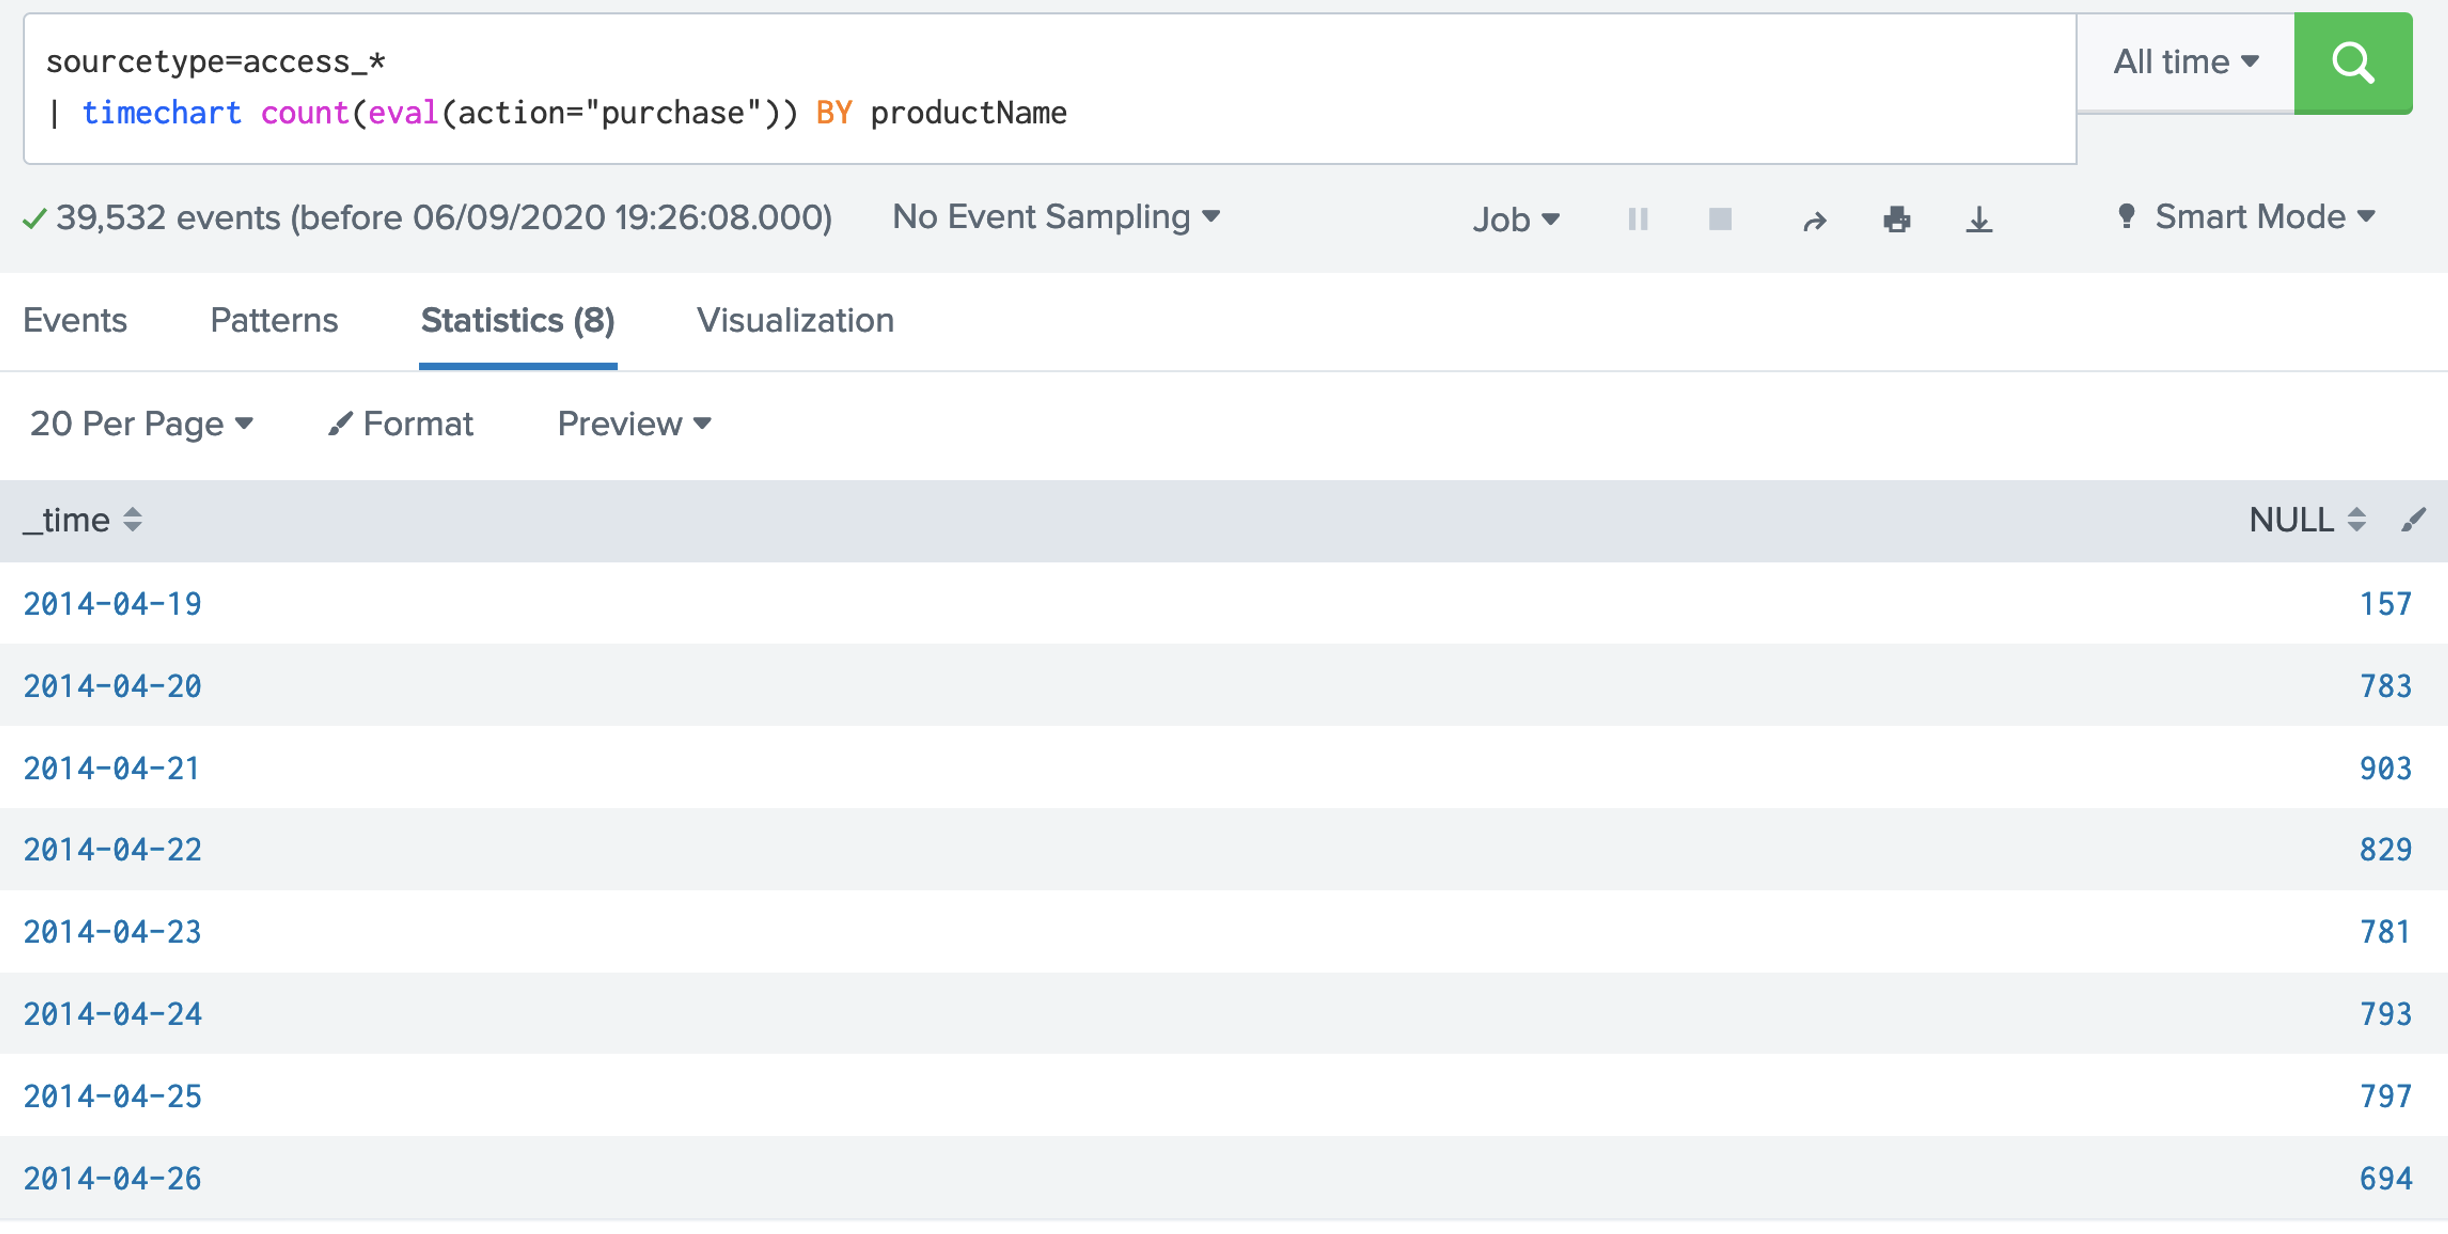 7. Next we can generate a chart: [here] sourcetype=access_* | chart count(eval(method="GET")) as GETFUNCTION 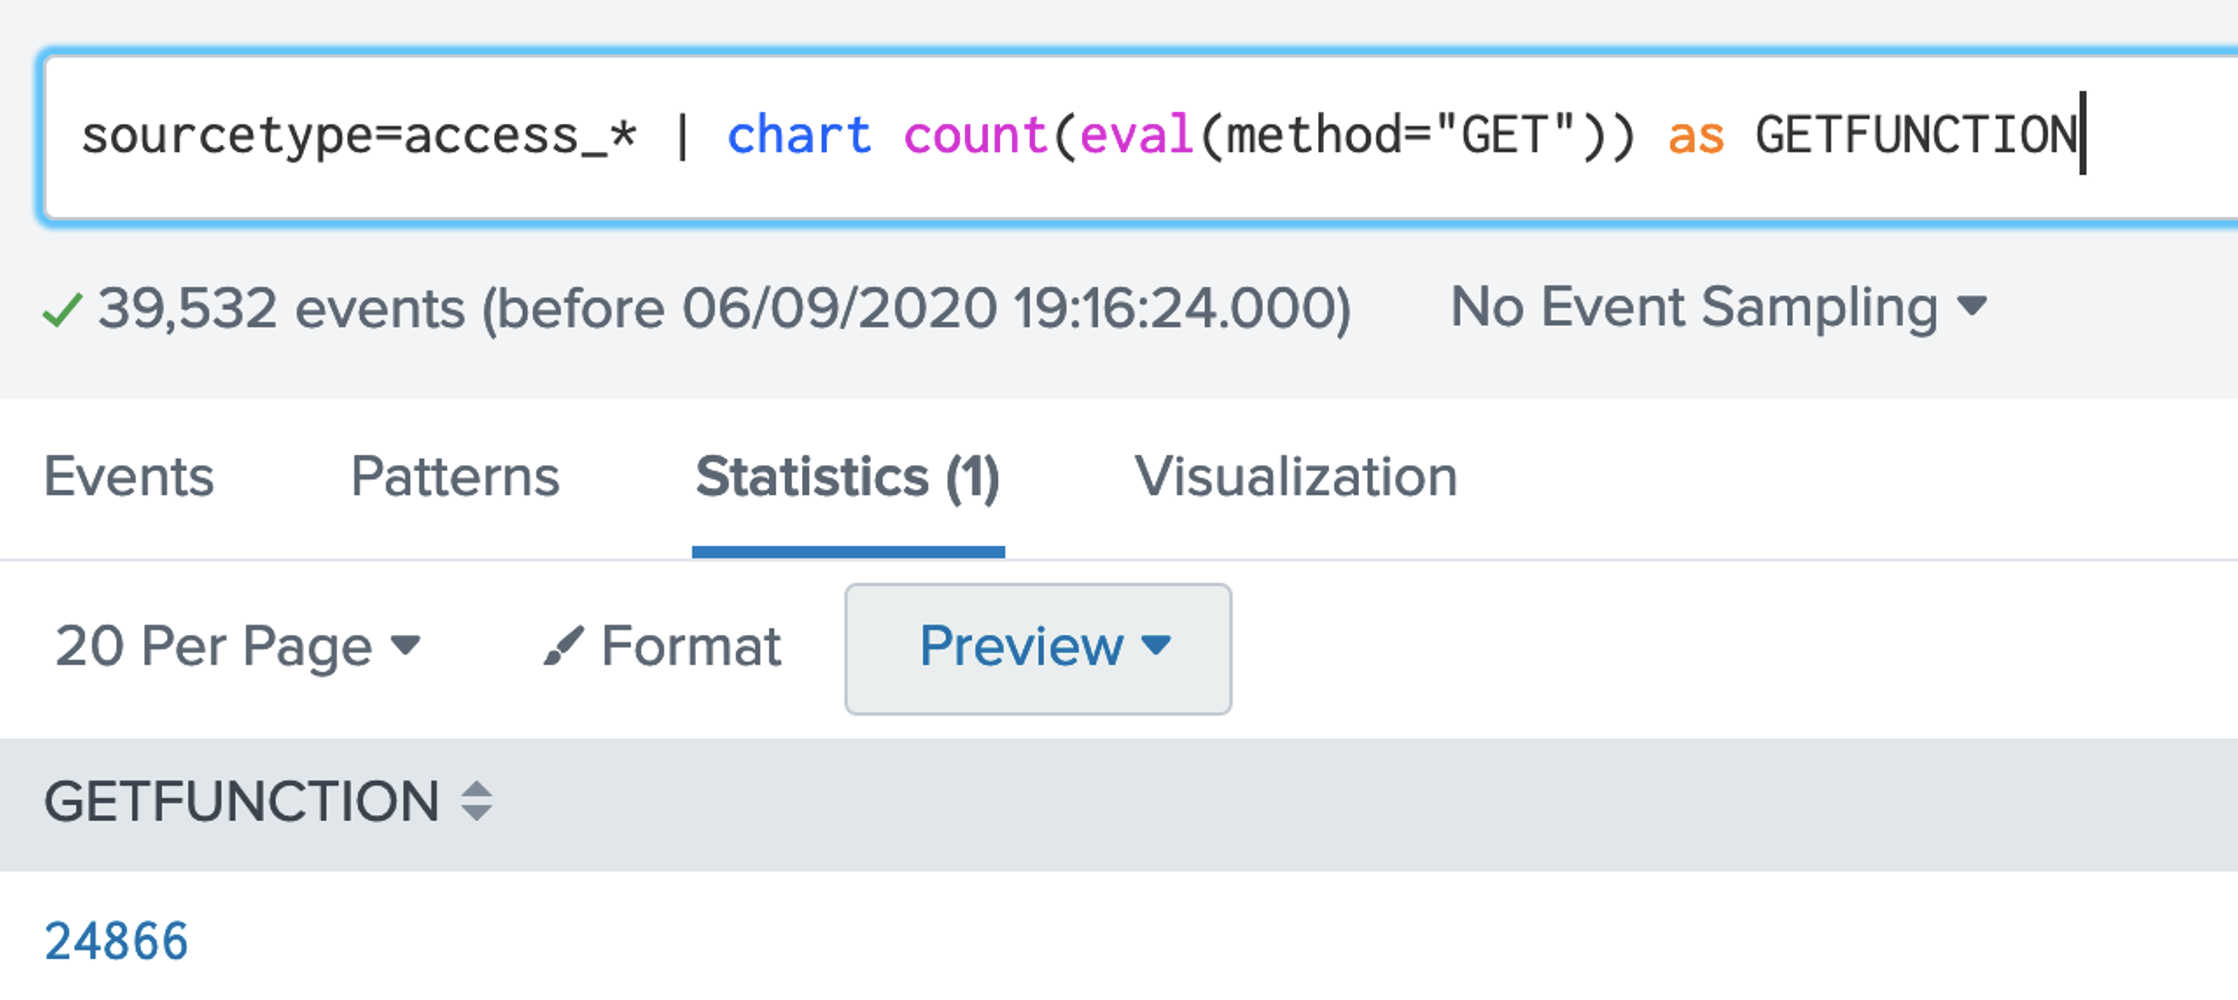 8. And then to chart our count values: [here] sourcetype=access_* | chart count(eval(method="GET")) AS GET, count(eval(method="POST")) AS POST by host 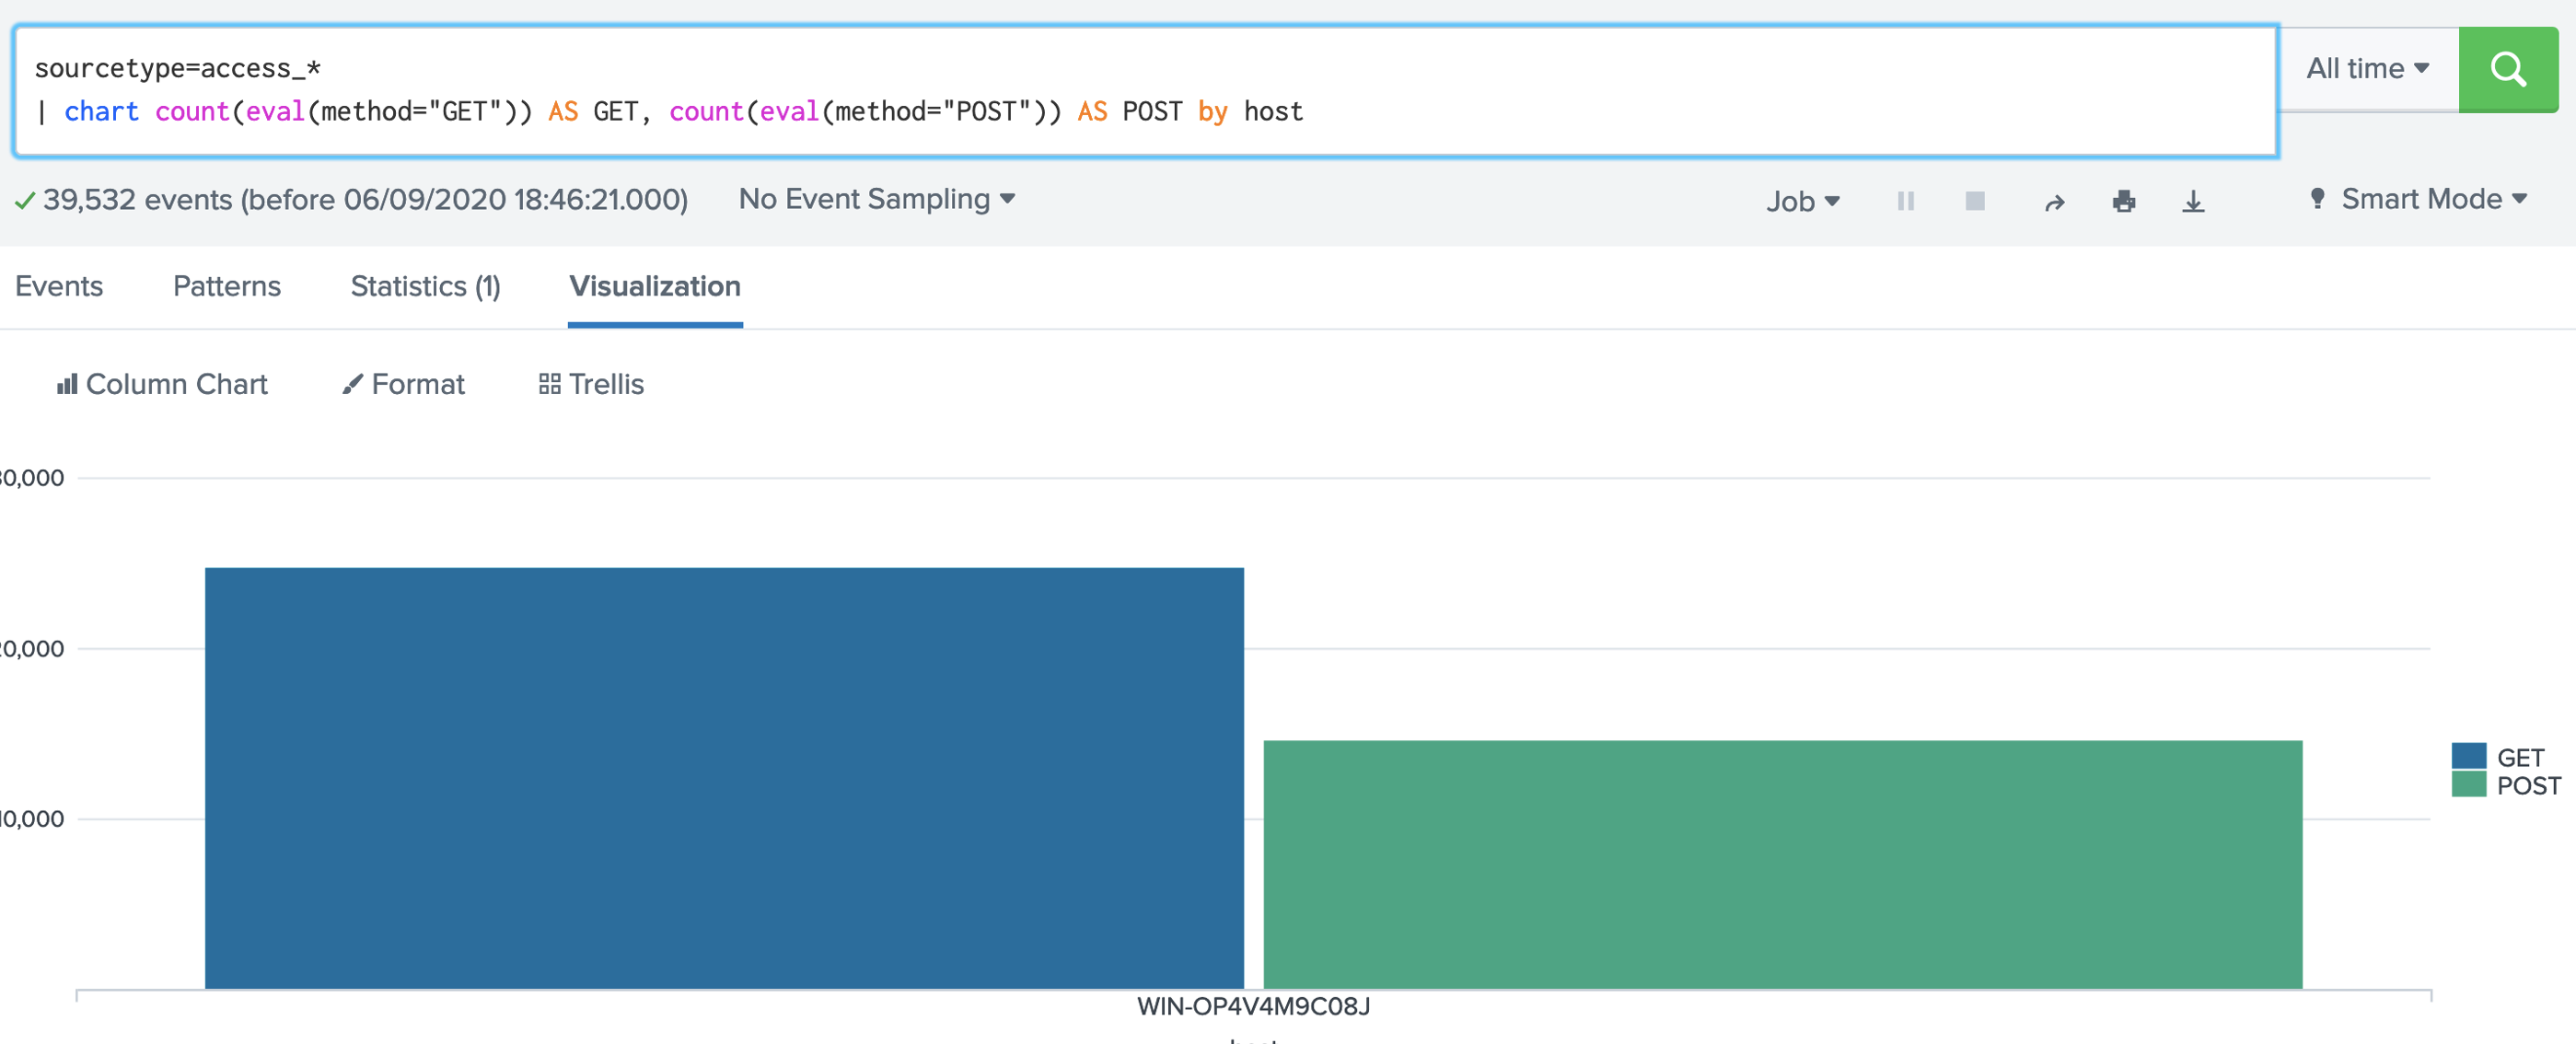 9. We can also perform a free search for a matching string with: [here]
sourcetype=access_*
| chart  count(eval(searchmatch("Safari")))  AS Safari, count(eval(searchmatch("Chrome")))  AS Chrome, count(eval(searchmatch("Mozilla"))) AS Mozilla by host
 |